
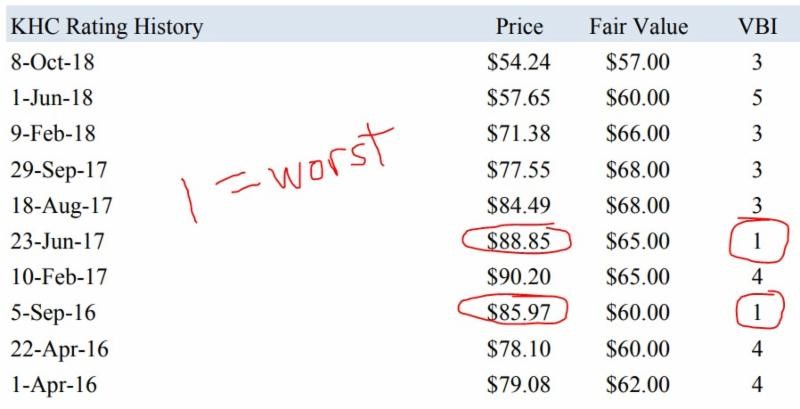
Image shown: The rating history of Kraft-Heinz (KHC). Valuentum members were warned in advance of this pricey equity in 2016/2017, and the VBI rating never advanced past 5 since then after registering a 1, the worst rating, on two separate occasions.
Dear members,
I wanted to first of all welcome our new members. There have been a lot of new ones during the past few weeks. Thank you. The buzz might be coming from the new book launch, Value Trap. If you haven’t read the book yet, please do so here. Members can get the pdf digital download today at 25% off. For new members, reading this book is simply par for the course to get a feel for how we look at things, and how we combine enterprise valuation, behavioral/relative valuation (P/E ratios, PEG ratios) and technical/momentum indicators. We’re not your traditional value and momentum research provider.
A few things up front. Our process is straightforward, but it can be confusing at times. For example, a new member to our website might see Kraft-Heinz’s fair value estimate at $57 per share and believe that we were wrong about this idea. Let’s talk about this. First, value is not a point fair value estimate, but a range of fair value outcomes. Kraft-Heinz’s equity fair value estimate range, based on our work, is between $43-$71, and only after today’s big landslide (it’s down almost 30% to ~$35 per share), do we now consider the idea worthy of a look. But we’re still not biting even if we think shares are starting to get attractive. Why? Well, it’s quite simple: We’d need the technicals to turn upward first to prevent this one from turning into a value trap.
But here’s where the rubber hits the road and why Kraft-Heinz was a slam dunk for our methodology. In 2016 and 2017, Kraft-Heinz registered a 1 (the worst rating on the Valuentum Buying Index) on not one but two separate occasions. Members had months to truly reconsider their positions at near-peak prices. A 1 on the Valuentum Buying Index implies a stock that we think is overvalued on an enterprise valuation basis (even after considering the fair value estimate range), is unattractive on a relative/behavioral valuation basis, and is exhibiting weakening technicals/fundamentals, suggesting the market is losing confidence in its market valuation, too.
The way to think about this call on Kraft-Heinz is very simple. We said the stock was significantly overpriced in 2016/2017, and it took just a couple years for shares to collapse. The enterprise valuation process worked. The Valuentum Buying Index rating system worked. Our fair value estimate range continues to work in building in a margin of safety before we would ever consider shares, and our technical and momentum overlay adds another check and balance to the system to make sure we don’t jump head first into a falling knife. Everything is lining up as it should. Kraft-Heinz was never a consideration in any simulated newsletter portfolio.
It is in these examples where our methodology shines through, in my opinion. Kraft-Heinz was a Warren Buffett favorite, it was believed to be a “value” stock (there’s a inside joke here for those that read Value Trap), and its brand name is as recognizable as any other on the planet. Most bought into the Kraft-Heinz “story,” but methodologies that keep you away from blow ups like this are worth their weight in gold, in my opinion. It’s easy to stay away from a “dot-bomb” like Stamps.com (STMP), which is also tumbling today, but Kraft-Heinz lured in even the most savviest of investors. Not those that were following Valuentum’s work, however.
This is also a good time to remind you what matters. It would have done our members no good if we would have released an early take this morning on Kraft-Heinz. The damage was already done. How fast we react to news isn’t how you measure the value of a research provider. There’s no way we could compete with the likes of Goldman Sachs and other providers that have dozens of analysts in that respect. Where we win is working to get ahead of developments and using our expertise in enterprise valuation with an openness to the information contained in prices to do so (as in warning about Kraft-Heinz in 2016/2017, not bringing up the conversation today). This is how we win, and how we keep winning. We anticipate. We don’t react, and we certainly don’t overreact.
A few answers to some member questions. First, what’s the best way to dig deep and learn the Valuentum process? Read Value Trap, of course. It’s also available on Amazon here. Our process is very simple in “considering undervalued stocks on the way up” and “considering removing overvalued stocks on the way down,” but the book shows that there’s a lot that goes into arriving at these conclusions. I spend pages and pages talking about enterprise valuation in the text because it is that important. Second, where can members access the archived fair value estimates and VBI ratings for each company? These can be found on page 16 of each report, and for more extensive archives, the DataScreener is an excellent tool (as part of the Financial Advisor level membership).
Third, how can members see how each VBI rating is derived? There is a flow chart on page 14 of each 16-page stock report. Fourth, where can members find a methodology walk-through and where can they learn to best navigate the website? You can tune into our latest tutorial here. Fifth, how does Valuentum use enterprise valuation and the Valuentum Buying Index (as well as the Dividend Cushion ratio) in the context of the simulated Best Ideas Newsletter portfolio and simulated Dividend Growth newsletter portfolio? Here is a helpful explanation from the FAQ section on the website:
A stock’s Valuentum Buying Index is based on our view of the attractiveness of a company’s discounted cash-flow valuation, its relative valuation versus peers, and an overall technical assessment. If our views on any of these three investment pillars change, a company’s Valuentum Buying Index rating will change to reflect this new view.
As it relates to the simulated Best Ideas Newsletter, for example, if a stock registers a 9 or 10 on the Valuentum Buying Index, we would consider adding it to the simulated newsletter portfolios. When the stock then/eventually registers a 1 or 2 on the Valuentum Buying Index in time, we might then consider removing it from the simulated newsletter portfolios. The changes in the “big middle” of the Valuentum Buying Index offer more tactical considerations, but we generally only consider the highest and lowest VBI ratings to be material. During times of market froth, however, as in arguably today’s environment, in the simulated Best Ideas Newsletter portfolio, we may relax some of the VBI criteria and consider undervalued stocks with neutral technical/momentum indicators, or fairly valued stocks with good relative valuation metrics and strong technical/momentum indicators. We may only consider removing ideas from the simulated newsletter portfolios when both their valuation and technical/momentum indicators point in the same direction (good/good or poor/poor), or if we’re making more strategic/tactical moves.
The criteria for the simulated Dividend Growth Newsletter is somewhat different. We’re looking for strong dividend growth stocks in this simulated Dividend Growth Newsletter portfolio (something that is not a part of the criteria in the simulated Best Ideas Newsletter portfolio), meaning that in addition to considering the VBI and fair value estimate range, the Dividend Cushion is also very important. We still look to add highly-rated stocks on the VBI and those that are undervalued to this simulated newsletter portfolio, but we may be more open to ideas that have strong dividend growth prospects, on the basis of the forward-looking Dividend Cushion ratio. After adding ideas to this simulated newsletter portfolio, we may continue to include them in the portfolio even if they have modest VBI ratings that are trading within our fair value estimate range, as long as they have strong dividend growth prospects. We’d only consider removing a stock from the simulated Dividend Growth Newsletter portfolio when we lose confidence in its intrinsic value support and its dividend growth prospects.
The way to think about our process is rather simple. In the simulated Best Ideas Newsletter portfolio, if a company registers a high rating in our coverage universe, we consider adding it (but we won’t consider adding all companies because of portfolio constraints). If we do decide to add the idea, then we watch its fair value estimate and technical/momentum indicators as it navigates the “big middle” of VBI ratings, and only consider removing the idea from the simulated Best Ideas Newsletter portfolio if it registers a 1 or 2 on the Valuentum Buying Index. In the simulated Dividend Growth Newsletter portfolio, we pay attention to the price-versus-fair value estimate range and the company’s Dividend Cushion ratio, as we’re looking for resilient equities with intrinsic-value support that have strong dividend growth prospects. Only when intrinsic-value support and dividend growth strength wane will we consider removing an idea from the simulated Dividend Growth Newsletter portfolio.
Just a reminder that we released the February edition of the Best Ideas Newsletter on the 15th. You can download that here (pdf). Please note a basic membership includes access to not only the 16-page valuation reports and supplemental dividend reports and commentary, but also two newsletters. Most other research firms charge you a la carte for each newsletter, but you get two newsletters as part of the basic premium package (the Best Ideas Newsletter, which is released on the 15th of the month and the Dividend Growth Newsletter on the 1st of the month). It’s quite the bargain!
Just a few final things as we wrap up. My colleague Kris Rosemann dug into some recent news impacting a few high-profile dividend payers (OMI, KO, TXRH, DPZ, WM, GPC, GIL) in this note here (login required). We also updated a number of industries while we’ve taken it easy on your inbox (Financial Technology, Automakers, Air Freight & Logistics, Diversified Miners, and Agricultural Equipment, among others). Our update cycle is every 3-4 months driven by valuation changes, and we think this approach adds the most value as it smooths out “false signals.” One last thing: as the market continues to recover from the December 2018 lows, we remain “fully invested” in both the simulated Best Ideas Newsletter portfolio and simulated Dividend Growth Newsletter portfolio. What a call this has turned out to be!
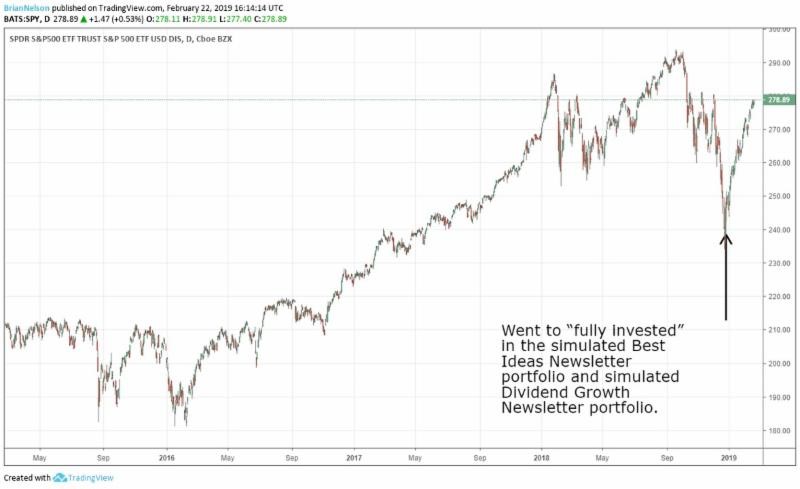
Image shown: In our December 26 note to members, we moved the simulated Best Ideas Newsletter and simulated Dividend Growth Newsletter portfolio to “fully invested” from a cash “allocation” of 30% and 20%, respectively at the high end of the range. It has worked out wonderfully as we keep our finger on the put option trigger in case price-agnostic trading and heightened volatility rears its ugly ahead again, as it did in December 2018. Read Value Trap!
That’s it for now. If you have any trouble accessing premium content on our website, please contact us and we will look into the status of your membership. Thank you!
Food Products (Small/Mid-Cap): CALM, DF, FLO, FDP, HAIN, HRL, JJSF, LANC, MKC, SJM, THS, TSN
Food Products (Large/Mid-Cap): ADM, BG, CPB, CAG, GIS, HSY, K, KHC, MDLZ, NSRGY, UL, UN
Tickerized for holdings of the SPDR S&P 500 ETF (SPY).
—–
Valuentum members have access to our 16-page stock reports, Valuentum Buying Index ratings, Dividend Cushion ratios, fair value estimates and ranges, dividend reports and more. Not a member? Subscribe today. The first 14 days are free.
Brian Nelson does not own shares in any of the securities mentioned above. Some of the companies written about in this article may be included in Valuentum’s simulated newsletter portfolios. Contact Valuentum for more information about its editorial policies.