
The Dividend Cushion ratio is one of the most powerful financial tools an income or dividend growth investor can use in conjunction with qualitative dividend analysis. The ratio is one-of-a-kind in that it is both free-cash-flow based and forward looking. Since its creation in 2012, the Dividend Cushion ratio has forewarned readers of approximately 50 dividend cuts. We estimate its efficacy at ~90%.
By Brian Nelson, CFA
Dividend investing has probably never been as popular as the past couple years. Remember, however, the dividend is capital appreciation that otherwise would have been achieved had the dividend not been paid. If you had a stock that was $10, and it paid a $1 dividend, you don’t have a $10 stock and a $1 in dividends, you have a $9 stock and a $1 in dividends. Stock returns are in part a function of the company’s ability to generate free cash flow as time passes.
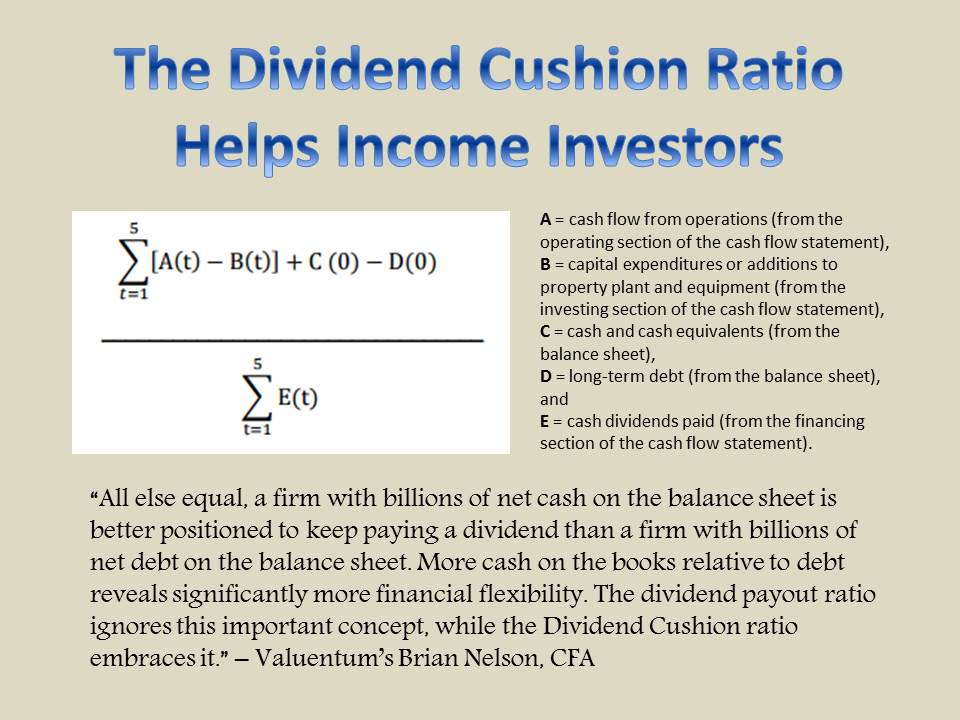
The accumulated free cash flow is added to the firm’s value over time, and the company’s intrinsic value advances, all else equal. If a company pays a dividend, that accumulated cash is reduced by the amount of the dividend, and so is the firm’s intrinsic value. This is why a firm’s stock price is reduced by the amount of the dividend on the ex-dividend date. What drives stock prices and returns is a company’s net cash on the balance sheet and future expectations of free cash flow.
The dividend is not a driver.
That said, the dividend is an important source of income for many investors that have opted to forgo strategic portfolio initiatives and industry-standard withdrawal rates. I’ve become a fan of the concept of a dynamic withdrawal rate to combat sequence-of-return risk in a portfolio setting, instead of relying on historical backtests on the probability of whether a 3% or 4% annual withdrawal rate will last. Worrying about sequence of return risk has cost so much in total return for so many investors, and it may have cost countless households the prospect of creating generational wealth.
At Valuentum, we like to use something called the Dividend Cushion ratio to estimate the probability that a firm will cut its dividend. We like to view the Dividend Cushion ratio as similar in substance to a corporate credit rating. For example, a poor corporate credit rating doesn’t necessarily mean a company will default on its debt, but it suggests that there is a high probability of default. Similarly, a low or negative Dividend Cushion ratio doesn’t guarantee a company will cut its dividend. It means that the probability of a dividend cut is higher in the longer run.
We also use qualitative ratings (e.g. GOOD) to overlay both the adjusted and unadjusted Dividend Cushion ratio. For example, if there’s a consistent dividend payer such as General Mills (GIS) that has a mediocre Dividend Cushion ratio (between 0.1 and 0.9), we may still assign it good qualitative marks, despite its Dividend Cushion ratio being below 1 (0.6). In many cases, it is the firm’s net-debt heavy balance sheet that weighs on its Dividend Cushion ratio, and such companies may still generate free cash flow that is more than their cash dividends paid.
We have to make more controversial judgments for other companies. Air Products (APD) is a good example. The company’s net debt position weighs on its Dividend Cushion ratio, and more recently the firm’s free cash flow has fallen below that of its cash dividends paid. However, because it is a Dividend Aristocrat that has pushed through ~40 consecutive years of annual dividend increases, we still give it good marks for its dividend. However, the firm’s Dividend Cushion ratio of 0.4 speaks to increased risk in the longer run.
The probability of a dividend cut at General Mills and Air Products in the longer run is higher than that of a secular-growing, net-cash-rich, free-cash generating powerhouse that has a 3+ Dividend Cushion ratio such as Microsoft (MSFT), for example, but their executive team’s respective willingness to keep and preserve their payouts, as evidenced by their status as Dividend Aristocrats, still translates into our assigning them good qualitative scores (for the time being), despite the higher observed financial risks.
The Dividend Cushion ratio ranks companies on the probability of a dividend cut in the longer run, while the qualitative ratings in part assess the outlook for the health of the payout in the near term in the context of management’s willingness to preserve and raise the payout. Since the systematic application of the Dividend Cushion ratio across our coverage in 2012, the Dividend Cushion ratio has forewarned readers of approximately 50 dividend cuts. We estimate its efficacy at ~90% at identifying the risks of a dividend cut in advance of the event.
———-

Brian Nelson owns shares in SPY, SCHG, QQQ, DIA, VOT, BITO, RSP, and IWM. Valuentum owns SPY, SCHG, QQQ, VOO, and DIA. Brian Nelson’s household owns shares in HON, DIS, HAS, NKE, DIA, RSP, QQQ, and SCHG. Some of the other securities written about in this article may be included in Valuentum’s simulated newsletter portfolios. Contact Valuentum for more information about its editorial policies.
Valuentum members have access to our 16-page stock reports, Valuentum Buying Index ratings, Dividend Cushion ratios, fair value estimates and range