

Image Source: Andy Maguire
By Brian Nelson, CFA
This month was an important one for our investment research firm, Valuentum, and its flagship newsletter, the Best Ideas Newsletter. The June 2016 edition means that we have now surpassed the 5-year anniversary of the inception of this newsletter’s portfolio (page 8). This is a critical time horizon that we and many others believe is a good one to assess the quality of any money manager.
Money managers can be lucky or unlucky over very short periods of time, as in the case of perhaps a 12-24 month period, but those that can generate and retain outperformance over a 5-year period and longer typically are doing a lot of things right, even if they get some things wrong. Remember, the performance of the Best Ideas Newsletter portfolio is not cherry-picked – it reflects all of our winners, all of our losers, transaction costs, and all of the decisions with respect to asset allocation and individual equity weighting within the newsletter portfolio since inception. There’s no better yardstick: in this no-called strike game of investing, it only matters when we swing.
That said, we’re never satisfied with the results of the newsletter portfolio, of course, as there is always room for improvement, but in light of the valuation risk embedded in the broader equity markets today and the frothy characteristics of some of the stocks with even the strongest business models, as in the case of the consumer staples sector (XLP), which is trading at nearly 21 times forward earnings, we’re quite happy. We’ve done a lot of things right in the portfolio-–adding undervalued stocks that are going up, or Valuentum stocks. Altria (MO) and Visa (V) are two great examples, with those positions nearly tripling since being added. We’ve also missed the mark a few times–Gilead (GILD) and Alibaba (BABA) are the latest two examples, unfortunately. We’ve cut those losses quickly, however. Prudence and care, as I say.
Sometimes our readers forget that on the website we actively cover thousands of stocks in full financial detail, too (our very own analysis), generating discounted cash-flow valuation models, fair value estimates, fair value ranges, Valuentum Buying Index ratings, and Dividend Cushion ratios and more. Though we’re not a financial advisor, we are truly a robust investment research provider, and we put everything out there in full view to the reader. Some of the data in the reports is not pretty; some of the numbers may not be intuitive–the negative growth rates when companies hit positive inflection points, our application of the risk-free rate, for example, but it’s all there (and you can ask to see our models to tweak our assumptions to reflect yours and even derive your own fair value estimate!). We don’t hide anything; all of our assumptions are in the 16-page valuation reports, our archived fair value estimates and Valuentum Buying Index ratings are on page 16 of each report. Is there another way?
The 5-year anniversary probably marks a good time to remind readers of the goals of the Best Ideas Newsletter portfolio (page 8), which differ from the goals of the Dividend Growth Newsletter portfolio (the newsletter that contains the latter is released on the 1st of the month); the Best Ideas Newsletter (this one) is released on the 15th of the month. Depending on the content and publishing cycle, these newsletters can be issued early in the morning or late in the evening, but they always are emailed to the email address we have on file. The Best Ideas Newsletter portfolio seeks to find firms that have good value and good momentum characteristics and typically holds each idea from a Valuentum Buying Index rating of a 9 or 10 (consider buying) to a rating of a 1 or 2 (consider selling). Just like a value manager may not include every single undervalued company in his/her portfolio, not all highly-rated companies on the Valuentum Buying Index are included in the portfolio either. We may tactically add to or trim existing positions in the portfolio on the basis of sector or broader market considerations, but we seek to capture a stock’s entire pricing cycle (from being underpriced with strong momentum to being overpriced with poor momentum). Valuentum is low-turnover, low-transaction costs–not to be confused with momentum strategies that differ greatly.
Let’s talk more about the metrics we use in our work. You may be familiar with factor models that use proxies for ‘value’ and ‘momentum’ indicators based on historical, widely-available information. Such analysis may be insightful, to a degree, in explaining relationships of the past, but such analysis is of little use in gauging future expected equity price direction, and it may even fall short of truly explaining past relationships, too. Metrics such as book-to-market, often used in academic work, by definition, use accounting book value (shareholders’ equity), but the metric for the vast majority of operating companies (i.e. non-financial companies) is near-meaningless. Here’s a snippet from Boeing’s (BA) balance sheet (2010, 2009) that illustrates how silly blindly using accounting data can be, for example.
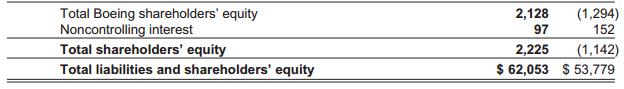
Image Source: Boeing’s 10-K, 2009
In the image above, Boeing’s accounting book value (i.e. Total Boeing shareholders’ equity) fell to -$1.3 billion (negative $1.3 billion) in 2009, and the measure today continues to be dwarfed by the actual market capitalization of the equity, the market capitalization being what the market believes the cash-flow generating assets of the company are actually worth, not the accounting representation. Can you imagine how many investors are still relying on accounting book value in their investment process for industrial operating companies, or worse yet, the measure return on equity, which applies the often-meaningless measure of accounting book value in the denominator, to make decisions? How many money managers on television have you seen mention ROE, or return on equity?
Please never focus on accounting book value or return on equity outside of the financial sector–the measure is near-meaningless, and ROE considers leverage which tells us little about the operating returns a company can generate (look up DuPont equation). Now that said, we make an important distinction regarding book value for financial companies. Book value in the case of banks, insurers, and other entities in the financial sector, including Berkshire Hathaway (BRK.A, BRK.B) is meaningful, because, unlike industrial operating entities, these companies use money to make money and capital strength (book capital) is very important to them. Industrial operating companies, on the other hand, use assets such as property, plant and equipment to make inventory to generate earnings and free cash flow, so book value is not relevant. In fact, the more capital needed to run their business, the less attractive the business is, all else equal.
But to the point, historical back-tested factor models that use less-meaningful information, as in the case of book value, aren’t as robust as they could be. That’s why we spend the vast majority of our time generating data that we think is much more relevant to the investment-decision making process on a forward-looking basis. Said another way, we’re not just throwing widely-available value and momentum data together and calling it ‘Valuentum.’ This is absurd. Within our fair value estimate calculation, for example, we add a company’s existing net balance sheet impact (its net cash), what it has today, to our expectations of the present value of its future enterprise cash flows, what it will generate tomorrow, to arrive at what we describe to be a fair representation of the equity’s value.
We then divide that equity value by diluted shares outstanding to get a fair value estimate per share, and then we compare that fair value estimate per share to the company’s stock price to see if there is a valuation opportunity. We’re bargain hunters. If there is a valuation opportunity, we put the stock on our radar, and if we like the company’s business model, as evidenced by our expectations for future economic value creation (ROIC>WACC), we may look to add the company’s equity to the newsletter portfolio, assuming its technical and momentum indicators are strong. The latter we use as evidence that the company is not a “value-trap.” Stocks that look cheap but keep going down often become “value-traps,” and because strong technical and momentum indicators suggest the latter can’t be true (i.e. the stock is going up!), the Valuentum process helps avoid such “value-traps.” Simple is often better, no?
There’s a lot of data out there–there’s probably too much. When it comes to equity analysis, however, there may not be data more important than what we generate internally at Valuentum for members: a free-cash-flow derived intrinsic value estimate and return on invested capital (ROIC) to assess the worth of a company and its ability to generate value for shareholders on the basis of its operating assets, respectively (not multiples or ROE). These two metrics, a fair value estimate and ROIC, are front-and-center when it comes to the information and data we present in the 16-page valuation reports. We’re not providing widely-available information that is and should be free on the web; instead we’re focused intensively on delivering value-added opinion and data to our members – and that’s in addition to the newsletters, ETF analysis, and beyond. Hope you like it!
The broad US equity markets continue to hold up well, all things considered. We’ve been very concerned about the probability of a rather large potential pullback, but falling interest rates continue to play into our thesis behind adding the SPDR S&P Dividend ETF (SDY) to the newsletter portfolios. On June 15, the 10-year Treasury yield fell to its lowest level since 2012 (~1.6%), and many are pointing to continued expectations of slow global economic growth and a central-bank playbook that is running short of options as the reasons for the fall (Treasuries are bought during uncertain/concerning times, driving their yields lower). Most of the globe is dealing with negative interest rates (Germany the latest instance), and yield-seeking investors have to go somewhere for income. Our thesis continues to be that, as yields on fixed-income instruments continue to fall, dividend growth equities will become more and more attractive, further inflating the “dividend growth” bubble. The 10-year Treasury yield (TBT, TLT) is approaching the record lows of ~1.4% set in July 2012. Here’s what we said when we added the SPDR S&P Dividend ETF to the newsletter portfolios April 20:
The dividend growth “track record” craze continues to be on in a big way, and we can’t help but feel there are similarities to the outcome of the ‘Nifty Fifty’ craze in the late 1960s and 1970s as there might be to dividend growth investing today. For those that may not be familiar, the ‘Nifty Fifty’ was a group of “buy-and-hold” large cap stocks that were largely credited with driving the market to new heights during the early 1970s. Many called these stocks with stable earnings one-decision stocks — they were to be bought and held forever. We have believed for some time that the proliferation of dividend growth investing may very well have the same effect on today’s market, propelling it ever higher, much like the “Nifty Fifty” did on the market some decades ago now.
Even if the strong performance of dividend growth equities may be more a result of the prospect of continued low interest rates (no alternative sufficient yield growth instruments), the question remains: Who is going to sell these dividend growth equities en masse in order for these stocks to experience abnormal and drastic declines? Overhead resistance is minimal and the very core of the dividend growth strategy centers on dividend reinvestment, which itself offers a solid backbone for even future advances of the equity. Most of the ‘Nifty Fifty’ underperformed during the bear market of the late 1970s, early 1980s, after their run higher, but they had their time. Dividend growth equities could similarly make a striking run higher for the next few years, until interest-rate and/or global growth expectations are inevitably reset, or not. They could run even longer.
To address this lingering idea, we are augmenting the already-strong Dividend Growth Newsletter portfolio with a 5% position in the SPDR S&P Dividend ETF, and we are also adding a 5% position in the SDY to the Best Ideas Newsletter portfolio ($81.33). We don’t necessarily prefer ETFs over individual stocks, but given the thematic nature of this thesis, we think an ETF makes the most sense. In the case of the SPDR S&P Dividend ETF, diversified exposure to over 100 equities that individually boast dividend track records of consecutive annual increases for the past 20 years hits directly on what’s in vogue in the market today. As more and more income investors pile into equities with long dividend growth track records, we believe most will be buying baskets of such stocks, or this ETF or another one like it, so there is little reason for us to have to take on incremental firm-specific risk with this idea to broadly target the outcome of this particular thesis.
That is not to say that other current holdings in the Dividend Growth Newsletter aren’t the best fit for a dividend growth strategy, but they are already in the portfolio. The SDY, in particular, has performed fantastically since the beginning of 2016, and with the quality of companies in the ETF, it may eventually turn into a long-term position in both portfolios. We expect alpha to continue to be generated by the collective portfolio constituents of both newsletter portfolios, and the ETF will also increase our equity exposure in light of the market’s ongoing push forward, reducing the drag of an outsize cash position.
What to make of broader market valuations? They’re not good. According to the latest Earnings Insight from FactSet, the forward 12-month price-to-earnings ratio of S&P 500 stocks is now nearly 17 times, well above its 5-year average of 14.6 and the 10-year average of 14.3. Valuations are being stretched and stretched, not because underlying fundamentals are improving significantly, but because the interest rate used within the market’s discount mechanism is fast-approaching zero, generating what we describe to be a magnified, sometimes exponential, impact on equity values. Under such a scenario, long-duration cash flows are worth more and more as their present value is enhanced from the lower expected interest rates. Here’s more about what we mean, from April 15:
Though a rather obscure article in the Journal, there was a rather peculiar story about how a Danish couple was paid interest on their mortgage. You read that correctly: they were paid interest on their mortgage, instead of paying interest. Denmark is not the only place that is pursuing NIRP either. Switzerland, Sweden, the European Central Bank and the aforementioned Bank of Japan are all using subzero rates in an effort to drive expansion. The story of the Danish couple may be overlooked by some, dismissed by others, but the implications are far-reaching when it comes to the laws of finance, in our view. Negative interest rates seem to bend everything we know about the financial discipline, and in some ways, break its core tenets. We’re in unchartered territory. Central banks around the world are playing with fire, and they know it.
As interest rates hover below zero in most of the world and the Fed contemplates the path of the federal funds rate in light of lackluster inflation and generally weak gross domestic product growth, the most important consideration in finance is starting to break down: the time value of money, or the idea that a dollar today is worth more than a dollar tomorrow (as the dollar today can be invested at a positive interest rate to be worth more in the future). Why is this important? For one, where future free cash flows within the valuation framework are worth less as they are discounted back to today, a negative discount rate means something entirely different. Certainly the cost of equity would mean discount rates stay positive even under NIRP thanks to non-zero equity risk premiums, but an asymptotic situation is likely to unfold as all-in discount rates on future free cash flows approach zero themselves. The result as the discount mechanism gets ever smaller: exponentially rising equity prices. This phenomenon seems to already be happening in the least risky areas of the equity markets, ones known for having the lowest costs of capital — the dividend-paying consumer staples arena.
Shares of Coca-Cola (KO) are now trading hands at ~$45 each, more than 22 times adjusted fiscal 2017 earnings. That’s fiscal 2017 earnings, not fiscal 2016 or trailing fiscal 2015 earnings. The market is granting the beverage giant such a lofty forward earnings multiple despite its full-year reported revenue falling 4% and reported operating income dropping 10% in 2015. Sure we can make a large number of non-GAAP adjustments to make the Coca-Cola’s results look better for the year, but the reported trajectory of the firm is downward, on a reported basis. Of course Coca-Cola is a great company, but the point we’re trying to make is that its shares have not been soaring because its fundamentals are doing great. The reality is that the discount rate that the market is placing on Coca-Cola’s future free cash flow stream is falling as expected interest rates collapse, driving the market’s view of its valuation (as evidenced by its price) higher, something exacerbated by dividend growth investors piling into the stock. We’re not saying readers should abandon the soda maker, but 22 times fiscal 2017 earnings is a lot to pay for any company, especially one where reported numbers are declining.
Coca-Cola is not the only company experiencing such an “asymptotic dynamic” either. Clorox (CLX) is trading at more than 24 times fiscal 2017 earnings, Colgate-Palmolive (CL) more than 23 times fiscal 2017 earnings, Kimberly-Clark nearly 21 times fiscal 2017 earnings, McDonald’s (MCD) more than 21 times fiscal 2017 earnings, Pepsi (PEP) at more than 20 times fiscal 2017 earnings, 3M (MMM) is trading at nearly 19 fiscal 2017 earnings, and Federal Realty (FRT) is exchanging hands at 27 this year’s expected funds from operations per share. Incredibly, most of these companies also hold net debt positions on the balance sheet, further illustrating the magnitude of enterprise “market cap” a lower discount rate is generating on these steady-eddy free cash flow generators. [Remember net debt is subtracted from enterprise value to arrive at equity value.]
Let’s update members on a few developments in the portfolio. First, our hearts and prayers go out to the families of the victims in the tragedy that happened at the Pulse nightclub in Orlando, Florida, early the morning June 12. We’ll be monitoring the Obama administration’s response to the attacks, and while we’ve generally been of the opinion that the impact on leisure and travel from terrorist activity is transitory, attacks have unfortunately become recurring, with the tragedies in San Bernardino, California, and Paris still fresh on the minds of many. Priceline (PCLN) is the holding in the Best Ideas Newsletter portfolio that is most exposed to such dynamics, but the company is so attractively-priced from a valuation standpoint and has such a long runway of growth ahead of it that we’re sticking with the company. We’re also monitoring rumors swirling about a potential tie-up with TripAdvisor (TRIP). Note that our valuation information for each company in our coverage universe can be found in each company’s ‘Stock Report (pdf)’ on its stock landing page. The vast majority of our analyst team’s efforts are focused on getting our fair value estimates and fair value ranges “correct.”
Apple (AAPL) is now approaching $100 per share again, and while we’re glad that we took some profits north of current levels, we’re even happier that we didn’t overreact on the pullback that sent shares to ~$90 a few weeks ago. It would take a lot for Apple to be completely removed from the Best Ideas Newsletter portfolio in light of the company’s fortress balance sheet and substantial free cash flow generation. We just hope Apple doesn’t do something as silly as Microsoft (MSFT) did in scooping up LinkedIn (LNKD). Microsoft CEO Satya Nadella “got sold” on a very, very bad deal, and fell for the oldest trick in the book–just because a firm’s stock price has fallen, as in the case of LinkedIn before the deal announcement, it doesn’t mean shares are cheaper. It’s going to take a while for us to get over this