
By Brian Nelson, CFA
Altria Group’s (MO) Performance to Be Weighted to the Second Half of the Year
On July 31, Altria Group reported second-quarter results that came in lower than expectations. Revenue net of excise taxes declined 3% to $5.3 billion as the firm experienced lower net revenue in its smokeable product segment, which was not completely offset by higher net revenue in its oral tobacco products segment. Adjusted diluted earnings per share came in unchanged at $1.31, as lower other operating companies income was offset by a lower share count. The company narrowed its full-year 2024 earnings per share guidance to the range of $5.07-$5.15, representing an adjusted diluted earnings per share growth rate of 2.5%-4.0%. Altria Group ended the quarter with $25 billion in short- and long-term debt and $1.8 billion in cash and cash equivalents. Cash from operating activities was $2.8 billion during the first six months of 2024, while capital spending was only $64 million, resulting in free cash flow of $2.7 billion. Cash dividends paid on common stock was $3.4 billion over the same time period, so Altria didn’t cover dividends with free cash flow during the first half of the year, but we expect it to do so for the full year. We still like Altria as a high yield dividend idea, with shares yielding 8% at the time of this writing.
Meta Platforms (META) Remains a Free Cash Flow Generating Powerhouse
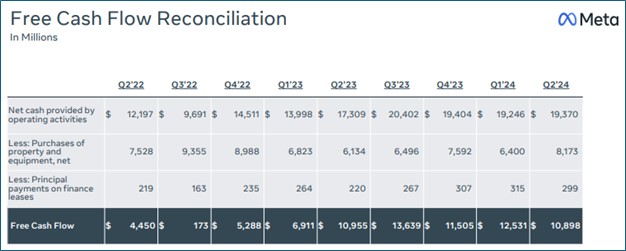
Image Source: Meta Platforms
Meta Platforms reported better than expected second quarter results on July 31 with revenue and GAAP earnings coming in higher than the consensus forecast. For the three months ended June 30, revenue increased 22% (23% on a constant currency basis), while it leveraged that growth into a 58% increase in income from operations. The company’s operating margin swelled roughly 9 percentage points in the quarter, to 38%, while both net income and diluted earnings per share leapt 73%. Both ad impressions delivered across its Family of Apps and average price per ad increased 10%, respectively. Meta is investing heavily in artificial intelligence, with capital expenditures increasing to $8.5 billion in the second quarter from $6.4 billion in the same period a year ago. Free cash flow held strong in the second quarter, coming in at $10.9 billion, down only modestly from the $11.0 billion recorded in the second quarter of last year.
Meta Platforms expects third quarter total revenue in the range of $38.5-$41 billion, the midpoint higher than the consensus forecast. The company maintained its outlook for full-year 2024 total expenses in the range of $96-$99 billion, and it raised its full-year capital spending guidance to the range of $37-$40 billion, the bottom end of the range increased from $35-$40 billion. Management expects “significant capital expenditures growth in 2025 as (it) invest(s) to support (its) artificial intelligence research and product development efforts.” All in, we liked Meta’s second quarter results, and the firm remains a net-cash-rich, free-cash-flow generating, secular-growth powerhouse.
Qualcomm Inc.’s (QCOM) Free Cash Flow Generation Impressive
On July 31, Qualcomm reported better than expected fiscal third quarter results that showed revenue and non-GAAP earnings per share coming in better than what the Street was expecting. On a non-GAAP basis, revenue increased 11%, earnings before taxes increased 25%, net income increased 26%, while diluted earnings per share increased 25%. The company experienced revenue growth of 12% in handsets and 87% in automotive, while sales in the Internet of Things (IOT) fell 8%. Looking to the fiscal fourth quarter, management expects revenue in the range of $9.5-$10.3 billion, the midpoint ahead of consensus, and non-GAAP diluted earnings per share in the range of $2.45-$2.65, the midpoint also ahead of consensus. Qualcomm ended the quarter with $13 billion in cash and marketable securities and $14.6 billion in short- and long-term debt. For the nine months ended June 23, 2024, cash flow from operations surged to $9.6 billion, up from $7.2 billion in the same period last year, while capital expenditures fell to $785 million from $1.2 billion last year. Free cash flow of $8.8 billion was materially better than the $6.1 billion mark it achieved in the nine months of fiscal 2023. All things considered, we liked Qualcomm’s fiscal third quarter results and cash-flow generation, and its outlook speaks of continued momentum behind its business.
Public Storage (PSA) Experiencing Weakness in Customer Move-In Rents
On July 30, Public Storage reported mixed second quarter results. Revenue increased to $1.17 billion from $1.12 billion in the year-ago period, while net income allocable to common shareholders fell to $468.4 million ($2.66 per diluted share) from $528.3 million ($3.00 per diluted share) in the prior-year quarter. Higher depreciation and amortization expense coupled with higher interest expense were the two drivers behind the weaker net income performance. Self-storage net operating income increased $27.8 million, but the increase was driven by its Non-Same Store Facilities, as Same Store Facilities revenue dropped 1% in the quarter due to “lower realized annual rent per occupied square foot and a decline in occupancy.” Costs of operations for its Same Store Facilities increased 0.9% due to higher property tax expenses. Reported core funds from operations (FFO) allocable to common shareholders came in at $4.23 per diluted share in the quarter, down from $4.28 in the period-year period. Public Storage repurchased $200 million of its common stock while it acquired two self-storage facilities and opened two newly developed facilities in the quarter. Public Storage lowered its outlook for 2024 revenue growth to the range of -1.5% to -0.5% from -1% to 1% previously due to weakness in customer move-in rents driven by industry-wide competition. 2024 net operating income growth is now forecasted at -3% to -1.3% from -2.4% to 0.7% previously. Public Storage also cut its 2024 core FFO per share outlook to the range of $16.50-$16.85 from $16.60-$17.20 previously. Though Public Storage is experiencing increased competition that is impacting customer move-in rents, we still like its business model quite a bit, and the firm remains a key holding in the High Yield Dividend Newsletter portfolio.
Albemarle Corp.’s (ALB) Liquidity Position is Worth Watching Closely
Albemarle reported disappointing second-quarter results on July 31. Net sales dropped 39.7%, while adjusted EBITDA fell 69.5%, and adjusted diluted earnings per share fell to just $0.04 from $7.33 in the same period a year ago. Cash flow from operations improved $289 million on a year-over-year basis to $363 million. The company noted that it delivered $150 million in productivity benefits and that it is “on track to exceed the company’s full-year restructuring and productivity target by 50%.” Despite the weaker performance, Albemarle maintained its full-year outlook and said that its previously published lithium market price of $15/kg “is expected to apply even assuming lower July market pricing persists for the remainder of the year.” Management also noted that it has initiated a comprehensive review of its cost and operating structure, as it faces a period of low lithium market prices and that it would recognize a $0.9-$1.1 billion charge related to its Kemerton site in Australia in the current third quarter. Assuming average lithium market prices of $12/kg-$15/kg, net sales are targeted in the range of $5.5-$6.2 billion for 2024, with adjusted EBITDA of $0.9-$1.2 billion on the year. Capital expenditures for fiscal 2024 is targeted in the range of $1.7-$1.8 billion. We haven’t liked Albemarle’s fundamental performance of late, but the company does have estimated liquidity of roughly $3.5 billion, which should buy it some time for the lithium pricing market to turn for the better. If there is prolonged weakness in lithium prices and Albemarle continues to spend aggressively on capex, a capital raise would not be out of the question. We’re sticking with Albemarle in the ESG Newsletter portfolio for now, however.
—–
NOW READ: 12 Reasons to Stay Aggressive in 2024
NOW READ: 2023 Was a Fantastic Year! Are You Ready for 2024?

Brian Nelson owns shares in SPY, SCHG, QQQ, DIA, VOT, RSP, and IWM. Valuentum owns SPY, SCHG, QQQ, VOO, and DIA. Brian Nelson’s household owns shares in HON, DIS, HAS, NKE, DIA, RSP, SCHG, QQQ, and VOO. Some of the other securities written about in this article may be included in Valuentum’s simulated newsletter portfolios. Contact Valuentum for more information about its editorial policies.
Valuentum members have access to our 16-page stock reports, Valuentum Buying Index ratings, Dividend Cushion ratios, fair value estimates and ranges, dividend reports and more. Not a member? Subscribe today. The first 14 days are free.