
Image Source: Microsoft Corporation – Second Quarter Fiscal 2020 IR PowerPoint Presentation
By Callum Turcan
A mid-weighted holding in our Dividend Growth Newsletter portfolio, Microsoft Corp (MSFT) continues to fly higher after reporting second-quarter earnings for its fiscal 2020 (period ended December 31, 2019) on January 29. Microsoft beat on both the top- and bottom-line versus consensus estimates, and shares of MSFT yield ~1.2% as of this writing. Outperformance at its cloud computing operations were largely responsible for the beat and nice forward-looking guidance.
Newsletter Portfolio Commentary
We continue to like Microsoft in our Dividend Growth Newsletter portfolio even though shares have run up above the top end of our fair value estimate range. The strong performance of Microsoft’s stock price of late indicates to us that the market is pricing in much stronger growth than our models suggest (free cash flow growth in particular, which could be the result of future margin expansion and future revenue growth), indicating we could be too conservative with some of our key valuation assumptions. In general, it isn’t until a newsletter portfolio holding’s technicals turn against the company that we consider removing the firm from our newsletter portfolio. Keep in mind we forecast very strong mid-cycle performance at Microsoft in our models, so in order to achieve this outperformance, the company must keep hitting it out of the park.

Image shown for informational/illustration purposes only. Valuentum is an investment research publishing company.
Before getting deeper into Microsoft’s latest quarterly report, take a look at our base case assumptions in the graphic below from our 16-page Stock Report (can be accessed here) covering the firm.
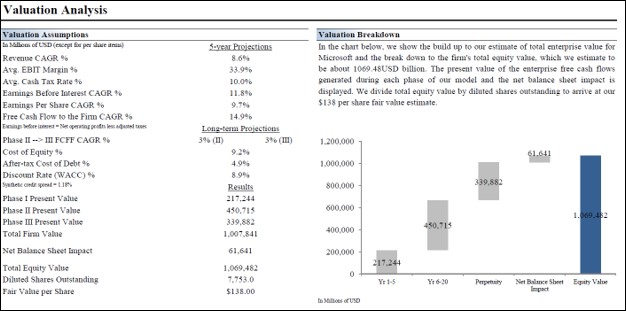
Image Shown: An overview of our base case valuation assumptions used in our Microsoft models, keeping in mind we could be a tad too conservative given the market’s growing optimism towards the name. We like to keep our big winners in our newsletter portfolios, even if shares run up above the top end of our fair value range estimate like MSFT has done as of this writing, as favorable technicals indicate shares could run higher still as the market prices in expectations for faster future free cash flow growth.
Quarterly Review
In the second quarter of Microsoft’s fiscal 2020, the firm’s GAAP revenues climbed higher by 14% year-over-year led by outperformance at its ‘Intelligent Cloud’ segment (revenues were up 27% year-over-year, driven by 62% revenue growth at its cloud computing unit Azure) and strong performance at its ‘Productivity and Business Processes’ segment (revenues were up 17% driven by growth at its Office suite of consumer products, Dynamic 365 products for enterprise resource planning and customer relationship management applications, and LinkedIn). We appreciate Microsoft’s success in the cloud computing world and at its business segments that are increasingly utilizing cloud-based solutions.
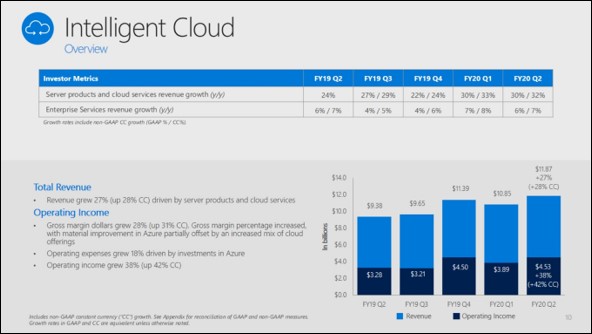
Image Shown: Microsoft’s ‘Intelligent Cloud’ segment performed very well last quarter and has been a source of strength in recent years, with its Azure unit leading the way. Image Source: Microsoft – Second Quarter Fiscal 2020 IR PowerPoint Presentation
Even better, Microsoft’s GAAP gross margins expanded by over 475 basis points to ~66.5% as economies of scale and most importantly, success at its Azure business drove its profitability levels higher. Stronger gross margins played a key role in boosting Microsoft’s GAAP operating margin higher by roughly 605 basis points year-over-year, which hit ~37.6% in the second quarter of fiscal 2020. Microsoft reported $13.9 billion in GAAP operating income, up over 35% year-over-year. That stellar growth is likely why shares of Microsoft continue to roar higher even after their epic run over the past five years. Here’s what management had to say during Microsoft’s latest quarterly conference call (emphasis added):
“Commercial Cloud revenue was $12.5 billion, growing 39 percent and 41 percent in constant currency. Commercial Cloud gross margin percentage increased 5 points year over year to 67 percent, driven again by material improvement in Azure gross margin percentage, which more than offset sales mix shift to Azure.
Company gross margin percentage was 67 percent, up 5 points year over year, driven by favorable sales mix and improvement across all three of our segments. In the quarter, gross margin percentage benefitted from lower console sales, stronger than expected software licensing results, and improvement in our commercial cloud gross margin percentage.”
For the full fiscal year, Microsoft is targeting 200 basis point expansion at its operating margin on a year-over-year basis, and please note that assumes operating expenses climb higher by 10%-11% in fiscal 2020. We appreciate management targeting meaningful margin expansion. Additionally, Microsoft provided guidance for the third quarter of its fiscal 2020 that pleased the market.
To enhance its EPS growth trajectory, Microsoft has been continuously buying back its stock. On a weighted averaged diluted basis, Microsoft’s outstanding common stock dropped from 7,768 million in the second quarter of fiscal 2019 to 7,691 million in the second quarter of fiscal 2020. During this period, Microsoft’s GAAP diluted EPS rose by 40% year-over-year to $1.51.
Financial Powerhouse
At the end of December 31, 2019, Microsoft’s cash, cash equivalents, and short-term investments balance stood at $134.3 billion. The firm’s short-term debt of $6.2 billion and long-term debt of $63.4 billion provided for a nice net cash balance of ~$64.6 billion. Please note that this huge cash hoard greatly strengthens Microsoft’s dividend coverage on a forward-looking basis and should allow for its impressive dividend growth story to continue on a per share basis through whatever macroeconomic conditions the company is faced with. We give Microsoft a Dividend Cushion ratio of 3.6x, and please note that factors in double-digit per share dividend growth over the next several years. Our Dividend Growth rating sits at Excellent. To read more about Microsoft’s dividend growth potential, please check out our two-page Dividend Report here—->>>>
Microsoft maintained its free cash flow cow status during the second quarter of fiscal 2020, generating $10.7 billion in net operating cash flow (up from $8.9 billion in the same period in the prior fiscal year) while spending $3.5 billion on capital expenditures (down from $3.7 billion in same period in the prior fiscal year). That allowed for $7.1 billion in free cash flow during the second quarter of fiscal 2020, up 37% year-over-year. Dividend obligations of $3.9 billion were easily covered by free cash flow, while $5.2 billion in share repurchases were partially covered by free cash flow and partially covered by Microsoft’s pristine balance sheet.
Concluding Thoughts
We continue to be impressed with Microsoft’s fundamental performance, and that’s clearly being reflected in its technical performance as the market prices in an ever-optimistic outlook. It won’t be until Microsoft’s technicals turn against the company that we would consider removing shares of MSFT from our Dividend Growth Newsletter portfolio. We like to let our winners run, within reason.
Software Industry – ADBE ADSK EBIX INTU MSFT ORCL CRM
Related: GOOG, GOOGL
—–
Valuentum members have access to our 16-page stock reports, Valuentum Buying Index ratings, Dividend Cushion ratios, fair value estimates and ranges, dividend reports and more. Not a member? Subscribe today. The first 14 days are free.
Callum Turcan does not own shares in any of the securities mentioned above. Microsoft Corporation (MSFT) and Oracle Corporation (ORCL) are both included in Valuentum’s simulated Dividend Growth Newsletter portfolio. Alphabet Inc (GOOG) Class C shares are included in Valuentum’s simulated Best Ideas Newsletter portfolio. Some of the other companies written about in this article may be included in Valuentum’s simulated newsletter portfolios. Contact Valuentum for more information about its editorial policies.