
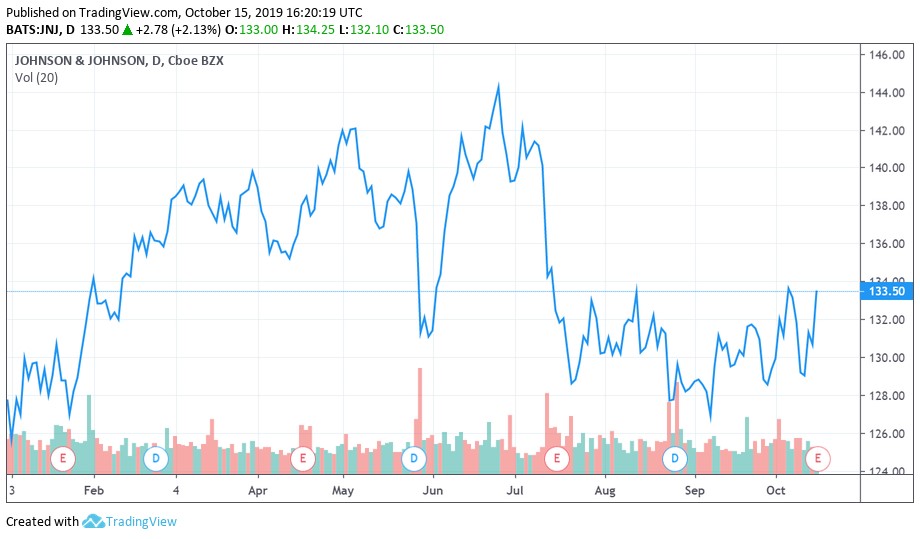
Image Shown: Shares of Johnson & Johnson climbed higher on October 15 after reporting a nice third quarter earnings report and raising guidance for the full year.
By Callum Turcan
On October 15, Best Ideas Newsletter and Dividend Growth Newsletter holding Johnson & Johnson (JNJ) reported third-quarter 2019 earnings that were positively received by the market. The healthcare giant once again boosted full-year non-GAAP sales and EPS guidance, which we appreciate, on the back of solid performance at its ‘Pharmaceuticals’ and ‘Medical Devices’ segments. Please note that Johnson & Johnson had already raised its guidance for 2019 twice before this latest increase, which we covered in this July 2019 piece here and this April 2019 piece here.
During the third quarter, Johnson & Johnson posted adjusted operational sales growth north of 5% year-over-year (a non-GAAP figure that excludes the impact of foreign currency movements, and acquisition and divestment activity) while non-GAAP adjusted EPS growth clocked in a tad above 3% year-over-year. Shares of J&J yield ~2.8% as of this writing, and we continue to like the company in both newsletter portfolios. Please note that Johnson & Johnson’s GAAP results have been facing meaningful foreign currency headwinds due to the relative strength of the US dollar.
Quarterly Overview
Johnson & Johnson’s STELARA offering (used to treat Crohn’s disease, plaque psoriasis and psoriatic arthritis) saw worldwide sales jump 30% year-over-year on a reported basis (that metric includes the impact of foreign currency movement), hitting $1.7 billion last quarter. Oncology offerings DARZALEX and IMBRUVICA also sold well in the third quarter, reporting 54% and 31% year-over-year reported sales growth worldwide, respectively. Johnson & Johnson’s ‘Pharmaceuticals’ segment is insulated from foreign currency headwinds to a degree as ~55%-60% of the segment’s sales are generated in the US. Not to imply that these headwinds aren’t significant, but a combination of a large domestic presence combined with strong underlying demand for its offerings (a product of quality R&D investments) is supporting Johnson & Johnson’s growth trajectory.
The company’s ‘Medical Devices’ segment saw underlying sales growth at its trauma, contact lenses, electrophysiology products, and other offerings during the third quarter. Johnson & Johnson’s ‘Consumer’ segment saw underlying sales growth at its NEUTROGENA beauty products line, offset by weaker baby care product sales. In the graphic below, note Johnson & Johnson’s nice adjusted operational sales growth (again, a non-GAAP figure) but we caution that its GAAP sales growth was just ~2% year-over-year last quarter.
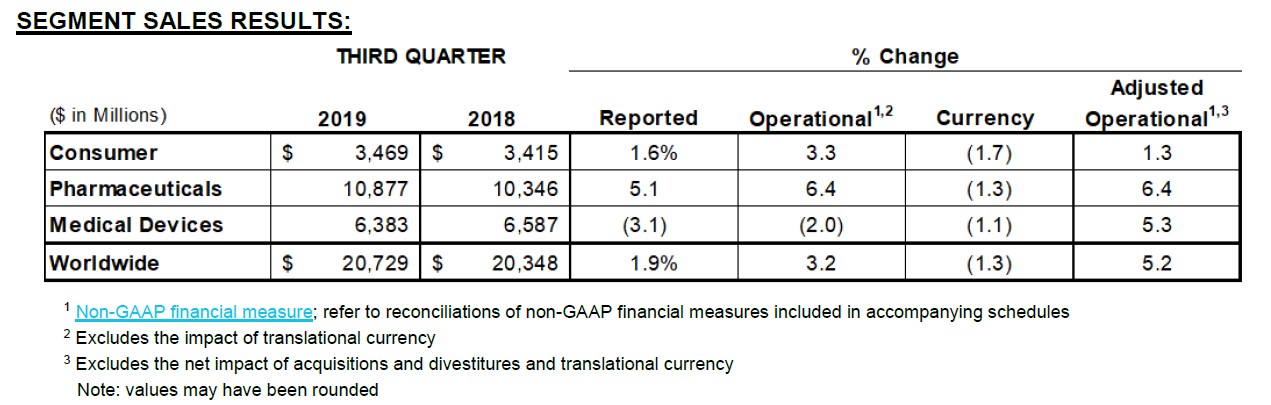
Image Shown: Johnson & Johnson’s GAAP sales growth is contending with significant foreign currency headwinds, but underlying demand for its broad-based healthcare product offerings remains quite strong. In particular, Johnson & Johnson’s ‘Pharmaceuticals’ segment is doing very well. Image Source: Johnson & Johnson – Third quarter 2019 earnings release
Management significantly raised expectations for Johnson & Johnson’s 2019 performance in October from its July forecast, which we really like as the firm had already increased guidance a couple times earlier this year, as mentioned previously. As you can see in the graphic below, the company is now targeting (non-GAAP) 4.5%-5.0% adjusted operational sales growth in 2019, up from 3.2%-3.7% just a few months prior. GAAP sales growth is now expected to be positive this year, a nice improvement from the previous forecast calling for negative GAAP sales growth this year, and the bump in non-GAAP adjusted EPS growth is also very welcome.
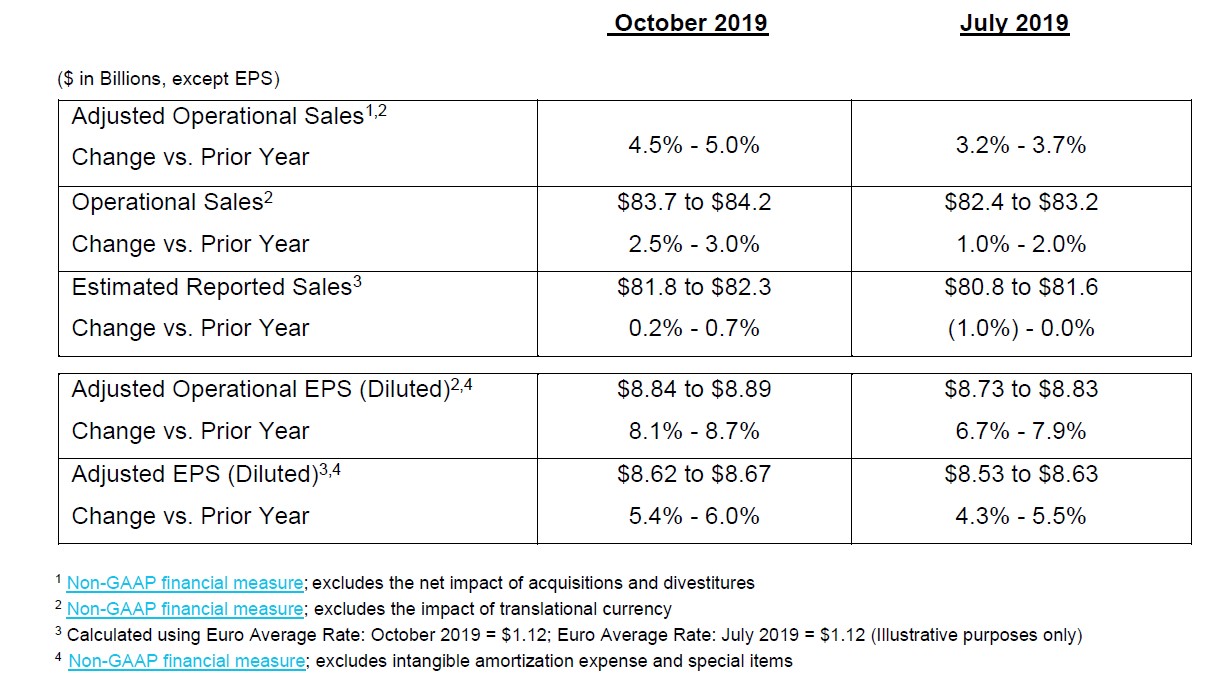
Image Shown: Management raised Johnson & Johnson’s full-year 2019 guidance during the firm’s third quarter earnings cycle, continuing a trend that we very much appreciate. Image Source: Johnson & Johnson – Third quarter 2019 earnings release
We’ll know more about Johnson & Johnson’s financial status when the firm posts its 10-Q filing sometime soon. Readers should note that the firm’s GAAP gross margin came under pressure in the third quarter, falling by 70 basis points versus the same period the prior year (in large part due to foreign currency pressures shaving 130 basis points off of the firm’s top line growth last quarter), which was mitigated by management controlling GAAP operating costs. Selling, marketing, and administrative expenses consumed 26% of the company’s total GAAP sales, down 130 basis points from the same period last year. R&D expenses were broadly flat after adjusting for the in-process R&D expense recorded in the third quarter of 2018 (a product of Johnson & Johnson’s acquisition activity and GAAP rules).
Legal Issues and Financial Strength
Johnson & Johnson has come under pressure from mounting lawsuits and potential legal liabilities stemming from its alleged role in the US opioid epidemic (this year the firm lost a court case in Oklahoma and was ordered to pay ~$0.6 billion), that the company’s talc-based baby powder products allegedly cause cancer (the firm lost a major court case on this issue in July 2018 and was ordered to pay $4.7 billion), and that Johnson & Johnson’s antipsychotic drug RISPERDAL allegedly causes abnormal growth of breast tissue in males (with the firm very recently getting hit with an $8 billion judgement).
We would like to stress that while the headline figures look menacing, most of these judgements will likely be brought down in the future. More broadly, Johnson & Johnson has the capacity to take these hits while still representing a quality investment. Unless these rulings cause a fundamental change in Johnson & Johnson’s ability to conduct business, they have a much smaller impact on the fair value estimate than at first glance. Our September 2019 article covered this topic in greater detail.
As of this writing, Johnson & Johnson’s market capitalization stands near $350 billion and the company had $17.9 billion in cash and cash equivalents on hand at the end of the third quarter (according to its IR presentation). The firm’s net debt load stood at $11.3 billion at the end of this period. We see Johnson & Johnson’s net debt load and legal liabilities as very manageable given the company’s strong free cash flow profile. From 2016-2018, its annual free cash flows averaged $17.3 billion, hitting $18.5 billion last fiscal year. Additionally, please note Johnson & Johnson’s stellar investment grade credit rating. While Moody’s Corporation (MCO) revised the firm’s outlook to negative back in August 2019 following the opioid case ruling, its senior unsecured credit rating was still reaffirmed at Aaa.
The company’s Dividend Cushion ratio of 2.4x supports a nice dividend growth trajectory in the face of these hurdles, especially as underlying demand for Johnson & Johnson’s products remains quite strong. When putting foreign currency and legal headwinds aside, Johnson & Johnson’s core businesses are performing quite well.
Concluding Thoughts
Mounting legal liabilities have been weighing negatively against Johnson & Johnson and its stock price over the past year as investors fret about the size of these potential settlements/judgements. We see the firm’s latest quarterly performance and guidance increase for 2019 as validation of the strength of Johnson & Johnson’s broad-based healthcare business model. Once the market gets a better idea of Johnson & Johnson’s total potential legal liabilities, shares could begin to converge towards their intrinsic value given the underlying strength in the firm’s businesses. Our fair value estimate for shares of JNJ stands at ~$150 per share. Check out Johnson & Johnson’s 16-page Stock Report here—->>>>
Household Products Industry – CHD, CL, CLX, ENR, HELE, JNJ, KMB, PG
Related: TEVA, MNK, ENDP, CAH, MCK, ABC
—–
Valuentum members have access to our 16-page stock reports, Valuentum Buying Index ratings, Dividend Cushion ratios, fair value estimates and ranges, dividend reports and more. Not a member? Subscribe today. The first 14 days are free.
Callum Turcan does not own shares in any of the securities mentioned above. Johnson & Johnson (JNJ) is included in Valuentum’s simulated Dividend Growth Newsletter and Best Ideas Newsletter portfolios. Some of the other companies written about in this article may be included in Valuentum’s simulated newsletter portfolios. Contact Valuentum for more information about its editorial policies.