
Member LoginDividend CushionValue Trap
|
U.S. Housing Market Showing Signs of Weakness
publication date: Sep 11, 2022
|
author/source: Callum Turcan
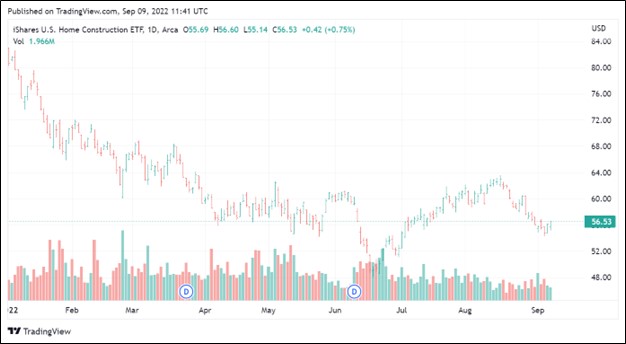
Image Shown: The US housing market is starting to show signs of weakness. Companies involved in the home building business in the US are starting to feel the heat, with the iShares US Home Construction ETF down ~30% year-to-date as of early September 2022 on a price-only basis. By Callum Turcan The national U.S. housing market has been on fire during the past few years. Sharp increases in U.S. housing prices are now contending with rising mortgage rates, which is prompting the question, are U.S. housing prices heading for a crash? Affordability issues are rampant, with many households now priced out of the market, and signs of weakness are emerging in the U.S. housing market. Background The Federal Reserve is increasing interest rates at a robust pace, albeit from historically low levels (the Fed’s key interest rate benchmark was near zero before the latest cycle of increases), and that’s driving up mortgage rates. As of early September 2022, the average 30-year mortgage rate stood near 5.9% according to a survey conducted by the Federal Home Loan Mortgage Corporation (FMCC), better known as Freddie Mac. For reference, a year ago the average 30-year mortgage rate was around 2.9% according to data cited by MarketWatch. In 2021, the S&P CoreLogic Case-Shiller U.S. National Home Price Index rose by almost 19% on an annual basis. That huge increase last year came on the heels of the index rising by over 10% in 2020, and this is while the U.S. economy was enduring the worst of the COVID-19 pandemic. Rising mortgage rates on top of double-digit annual increases in housing prices has likely pushed many renters and aspiring homeowners out of the housing market, removing a large chunk of demand from this picture (particularly at the lower end of the house price spectrum). Supply Not Keeping Up with Demand An analysis provided by Freddie Mac in May 2021 indicates that the U.S. had a housing supply deficit of 3.8 million units as of the fourth quarter of 2020. This is defined as the number of housing units needed to house each household along with a reasonable level of vacant units (healthy rental and housing markets require some level of vacant properties) compared to the number of housing units that were available. Put another way, Freddie Mac’s research could be interpreted that the U.S. was short of ~3-4 million homes during the final quarter of 2020. Effectively, U.S. housing supply has not been keeping up with household formation. Freddie Mac’s research indicates that the U.S. housing deficit has been steadily growing in recent years, rising from a deficit of 2.5 million units in 2018 to a deficit of 3.8 million units in 2020. Arguably, the biggest reason why home prices have boomed higher in recent years, beyond low mortgage rates, is that supply simply hasn’t yet up with demand. The U.S. population continues to grow but new home builds aren’t keeping up the pace. For this reason, while there are clearly risks building up in the housing space, any decline in housing prices on a national basis would likely be limited. That said, a shock to the upside with respect to mortgage rates could really complicate matters, and with the average 30-year mortgage rate standing near 5.9%, we can't completely rule out further increases in mortgage rates into the high-single-digits or even more, a level that would be much higher than rates during the latest housing meltdown in 2007-2009. Bankrate’s chief financial analyst recently noted that a plateau in U.S. house prices going forward after the recent boom was more likely than a major decline in housing prices. The chief economist at the National Association of Realtors agreed, citing the supply-demand imbalance as the main reason why U.S. home prices have some level of support. Confidence Plunging We're not completely convinced that we're out on solid ground with housing prices, however. The National Association of Home Builders/Wells Fargo Housing Market Index dropped 12 points in July 2022 to reach 55, the largest monthly drop in the index’s history save for the 45 point drop in April 2020 when COVID-19 ravaged the U.S. economy. The index (which has a range of 0-100) is at its lowest level since May 2020 and has been on a downward trend since the start of this year after coming in at 83 in January 2022 (which was down one point versus December 2021 levels, and the index kept declining from there). In July 2022, the index saw declines across all three of its reporting categories with current sales conditions, sales expectations over the next six months, and traffic of prospective buyers all dropping according to those surveyed. Though this survey is not an exact science by any means, it does appear that home builders are noticing a discernible decline in demand from prospective customers. Inflationary pressures are driving up labor/wage costs, building materials, and land acquisition costs while supply chain hurdles are making it more difficult to complete housing developments in a timely fashion, factors that are driving up the cost of new home prices. Higher housing prices combined with rising mortgage rates is creating a toxic combination as it concerns the health of the U.S. housing market. The upscale home developer Toll Brothers Inc (TOL) noted that it was seeing signs of weakness during its third quarter earnings report for fiscal 2022 (period ended July 31, 2022), though it also was optimistic regarding the chance for a modest rebound in demand as well. Here is what management had to say on the issue during the company’s latest earnings call (emphasis added): “All of these factors led to a market change in psychology and buyers remain cautious through the summer months. As a result, our net signed contracts were down approximately 60% in units compared to last year's historically strong third quarter. On a dollar basis, signed contracts were down 44% year-over-year as contracts in the third quarter benefited from price increases we have steadily applied throughout the year. For most of the third quarter, we purposely did not chase buyers with incentives as we felt demand was very inelastic. Buyers were on the sidelines. They were not looking for a better deal. On average, incentives in our third quarter contracts were approximately $16,000 per home, up only $5,000 from the average over the first half of 2022. In more recent weeks, we have seen signs of increased demand, as sentiment appears to be improving and buyers are returning to the market. With higher quality traffic, we have also started to modestly increase incentives, which buyers are responding to. August sales included an average incentive of about $30,000. In the first three weeks of August, our average weekly nonbinding deposits were up 25% compared to July.” --- Douglas Yearley, CEO and Chairman of Toll Brothers Though Toll Brothers is seeing signs of demand rebounding, it does appear that the firm is offering significantly more incentives to entice prospective customers. Its average incentives per home almost doubled from the quarter ended July 2022 to August 2022, according to recent management commentary. That’s quite the jump in such a short period of time. As Toll Brothers tends to cater to more affluent customers, signs of weakness here indicates that the entire U.S. housing market is likely contending with major affordability issues. Mortgage Market Slowing Down According to ATTOM, a provider of US property data, residential purchase mortgage originations dropped in ~95% of the metropolitan regions covered in its report from the final quarter of 2021 to the first quarter of 2022. The total number of purchase mortgages lenders originated dropped by 18% from the final quarter of 2021 to the first quarter of 2022 and were down 12% year-over-year in the first quarter of 2022, according to ATTOM. Beyond builder confidence weakening, the U.S. mortgage origination market is clearly slowing and there are plenty of signs that this weakness extends far beyond the refinancing space. The National Association of Realtors noted that existing U.S. home sales dropped 6% in July 2022 versus June 2022 levels and were down 20% year-over-year in July 2022. As interest rates and mortgage rates are on the rise, the level of refinancing activity would naturally decline, but the decline in mortgage originations seems to also be due to a steady decline in the pace of US home sales. In July 2022, existing home sales declined for the sixth consecutive month according to the National Association of Realtors. Data provided by Black Knight Inc (BKI), which provides a variety of services and solutions to the U.S. mortgage industry, indicated U.S. home price growth slowed down sharply in June 2022. In some markets along the West Coast (such as Seattle and San Francisco), Black Knight noted that home prices were pulling back from their recent peaks as of June 2022. Though it will take time for the recent increases in mortgage rates to be fully reflected in the US housing market, cracks are already beginning to show up in some areas. Concluding Thoughts We are keeping a close eye on the health of the U.S. housing market. Given that U.S. home buyers are substantially more financially sound than they were, in the aggregate, during the housing bubble seen in the 2000s decade due to stricter lending requirements, we do not expect a repeat of the 2007-2009 Great Financial Crisis to occur. However, a slowdown in home building activity could be a sign of underlying weakness in the U.S. economy and potentially weakening housing prices for some time to come. Shares of the iShares US Home Construction ETF (ITB) are down 30% year-to-date on a price-only basis as of early September as investors are becoming increasingly concerned that a sharp slowdown in the U.S. housing industry is on the horizon. On August 19, we “raised” the cash allocation in the simulated Best Ideas Newsletter portfolio (link here). Additionally, on September 5, we published a note reiterating why we are now bearish (link here) and we strongly encourage our members to check out those articles. NOW READ: Massive Unrest in Europe, Energy Crisis Could Be the Catalyst to Topple the Global Markets ---------- Tickerized for holdings in the ITB, our banking coverage universe, as well as BKI, FMCC. Callum Turcan owns shares of DIS, META, GOOG, VRTX, and XLE. Some of the other securities written about in this article may be included in Valuentum's simulated newsletter portfolios. Contact Valuentum for more information about its editorial policies. Valuentum members have access to our 16-page stock reports, Valuentum Buying Index ratings, Dividend Cushion ratios, fair value estimates and ranges, dividend reports and more. Not a member? Subscribe today. The first 14 days are free. |


0 Comments Posted Leave a comment