Member LoginDividend CushionValue Trap |
The Valuentum Buying Index’s Flow Chart
publication date: Jul 28, 2021
|
author/source: Brian Nelson, CFA
Image: The Valuentum Buying Index (VBI) flow chart. Each stock in our general operating coverage receives a systematically-applied rating. The VBI should never be used by itself. By Brian Nelson, CFA We witnessed some solid second-quarter reports from Alphabet (GOOG) (GOOGL) and Microsoft (MSFT) after the close July 27, and Facebook (FB) is trading higher in sympathy with Alphabet’s blockbuster report. We maintain our view that big cap tech and large cap growth are the areas to be, and today, we’re pounding the table on our $3,500 fair value estimate of Alphabet. Note, we raised Alphabet's fair value estimate yesterday, and as is customary with our update cycle, the tables on the stock web page will be refreshed with updated data this weekend. Today, we took a fresh look at the reports for Boeing (BA) here (pdf), Caterpillar (CAT) here (pdf), Honeywell (HON) here (pdf), Lockheed Martin (LMT) here (pdf), 3M (MMM) here (pdf), UPS (UPS) here (pdf), and Waste Management (WM) here (pdf). Out of this mix, we include Honeywell and Lockheed Martin in the newsletter portfolios, and we’re least excited about Boeing given its huge net debt position and struggling free cash flow situation. All of them are great companies, however. The tables on their respective web pages will be updated this weekend with the screener refresh. Let’s talk about the in’s and out’s of the Valuentum Buying Index (VBI) rating a bit more. The VBI combines rigorous financial and valuation analysis with an evaluation of a stock's technical and momentum indicators. The VBI places considerable emphasis on a company's discounted cash-flow (DCF) valuation (talked about extensively in Value Trap), its relative valuation versus peers (both forward price-to-earnings ratios and price-earnings-to-growth ratios), and its technical/momentum indicators in order to help readers assess entry and exit points on the most interesting ideas. Yesterday, we explained how the VBI is used to map out where we think the stock is on its share price cycle after considering its fair value estimate relative to its share price and its technical and momentum indicators. But how do we capture all these variables within just one VBI rating, itself? For that, we present the flow chart at the top of this article that is included in each of the 16-page stock reports. Each general operating company receives a systematically applied rating between 1 and 10 according to the flow chart above. Let's follow the red line on the flow chart to see how a company can score a 10, the best mark on the index (a "Top Pick"). First, the company would need to be 'undervalued' on a DCF basis and 'attractive' on a forward-looking relative value basis. The stock would also have to be exhibiting 'bullish' technicals. The firm would need a ValueCreation rating of 'good' or 'excellent', exhibit 'high' or 'aggressive' growth prospects and generate at least a 'medium' or 'neutral' assessment for cash flow generation, financial leverage, and relative price strength. This is a tall order for any company, and very few stocks can achieve this status. Some will never. In fact, only Facebook fits the bill for a 10 at this time. Stocks that don't make the cut for a 10 are ranked accordingly, with the least attractive stocks, in our opinion, garnering a rating of 1--please have a look at the image at the top of the article to see how a 1 is derived. Most of our coverage universe registers ratings between 3 and 7, but at any given time there could be large number of companies garnering either very high or very low ratings, especially at market lows or tops, respectively. The Best Ideas Newsletter portfolio puts the VBI into practice. Only when stocks are undervalued based on the DCF process (supported by forward-looking relative valuation parameters) and showing strong technical/momentum indicators do we think they are attractive. The most attractive stocks based on this system are often included in the newsletter portfolios, but not all of them. There may be portfolio construction considerations, long-term business model/industry threats, or exogenous risks such as geopolitical or regulatory considerations that make a company’s fair value distribution bi-modal in nature, in contrast to the standardized fair value estimate range distribution we include in the 16-page stock reports for illustrative purposes. While in the newsletter portfolios, highly-rated stocks may inevitably experience lower VBI ratings upon subsequent report updates as either their share prices advance, price-to-fair value estimates change, or their technical/momentum indicators deteriorate. In most cases, a lower VBI rating with a portfolio holding often means that the share price has advanced and that our thesis is working out. The goal is not to have all high-VBI rated companies in the portfolio, as inevitably we want these companies to advance to our fair value estimate and beyond--and this means that they will inevitably have lower ratings (if things work out as planned). We sometimes like to let winners run past their fair value estimate, too. We do this for a few reasons. One, we could be too conservative with our fair value estimate range, meaning that we have underestimated the long-term potential at one of our favorite companies (again, a good thing). Two, if we don’t have a more attractive replacement, keeping the stock in the newsletter portfolio captures the most important component of investing: compounding. Third, by not making too many unnecessary moves in the newsletter portfolios, we also reduce tax consequences--another good thing. The Valuentum Buying Index is a powerful tool to use in conjunction with a variety of other investment considerations from the Economic Castle, the Dividend Cushion ratio, and the fair value estimate and range to forward-looking relative valuation assessments, the dividend yield, dividend growth prospects and beyond. Please always be sure to contact your financial advisor if any strategy may be right for you, and the VBI is not designed to be used by itself. We hope you continue to enjoy your membership, and please let us know if you have any questions. Why Valuentum Buying Index Ratings Matter >> ---- It's Here!
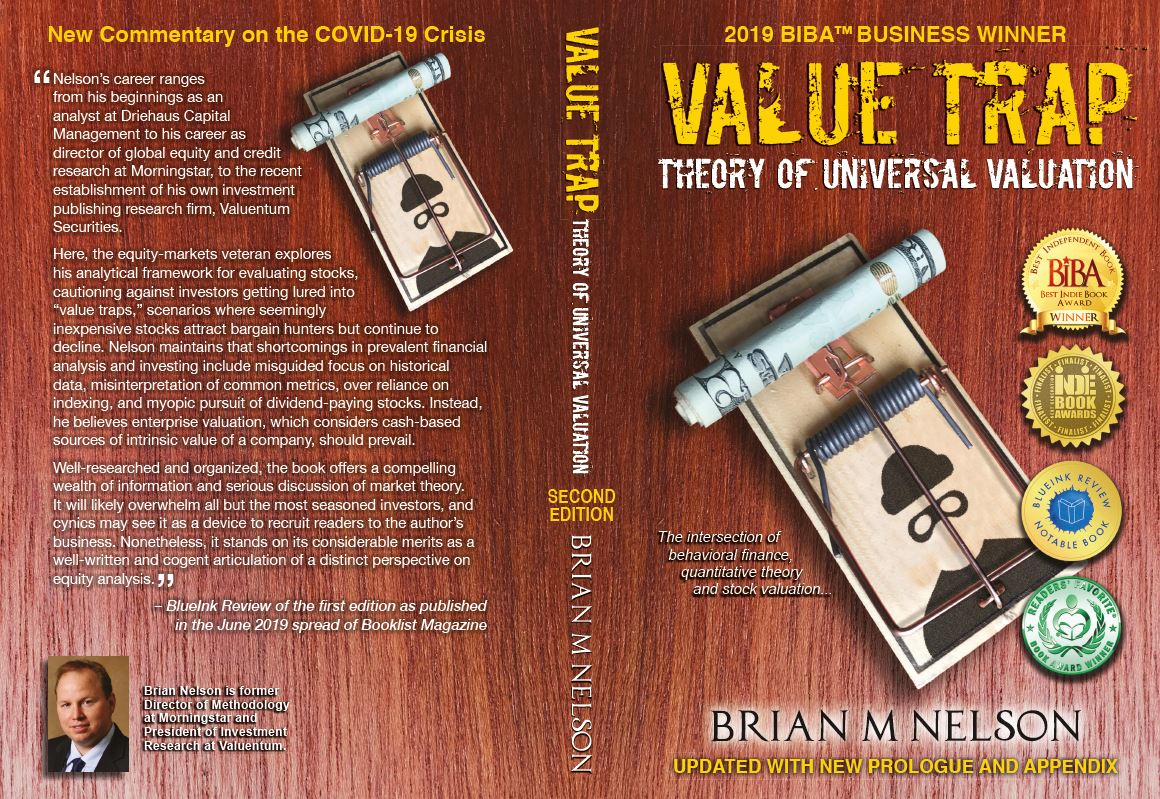
The Second Edition of Value Trap! Order today!

-----
Image Source: Value Trap ---------- Valuentum members have access to our 16-page stock reports, Valuentum Buying Index ratings, Dividend Cushion ratios, fair value estimates and ranges, dividend reports and more. Not a member? Subscribe today. The first 14 days are free. Brian Nelson owns shares in SPY, SCHG, QQQ, DIA, VOT, and IWM. Brian Nelson's household owns shares in HON, DIS, HAS. Valuentum owns shares in VOO, SCHG, DIA, and QQQ. Some of the other securities written about in this article may be included in Valuentum's simulated newsletter portfolios. Contact Valuentum for more information about its editorial policies. |


