Member LoginDividend CushionValue Trap |
Outperformance of Valuentum's COVID-19 Ideas
publication date: Sep 17, 2020
|
author/source: Brian Nelson, CFA
 Image: Valuentum's COVID-19 ideas. Hypothetical returns are calculated on a price basis.
---
Dear members:
---On March 17, Valuentum released its best ideas for the COVID-19 pandemic. The original article can be found at the following link, "Top Ten Ideas for Consideration Amid COVID-19." The note is significant for two reasons: 1) it was released practically at the March bottom, and 2) it identified outperforming ideas, which on an equal-weight basis outperformed the S&P 500 since then by 20 percentage points, generating a hypothetical price-only return of 64.2% (the dividend adjustment is negligible since then so it was left out of the calculation). ---
Please note that this is the only list that we released for our top 10 ideas to consider amid COVID-19, so there's no cherry-picking of these ideas. We released another article of the top 10 dividend growth ideas for COVID-19, and an equal-weight portfolio of these ideas also outperformed over their time period on a price-only basis. For every member that may want to hear how great our hypothetical performance during the COVID-19 crisis has been, there might be a member that may not want to hear about it, so I'm treading lightly with this note. Nonetheless, I think you should know how awesome our stock selection has been.
---
There's another reason why I'm writing this note. On several occasions during the past few years, I have received portfolio analysis from members on indexes or different portfolios that have been backfilled. What does this mean? Well, instead of the example above where we highlighted ideas at a certain date and then measured them on a walk-forward basis in simulated fashion (as in the table above, from March 18 through September 17), an index provider or someone analyzing a current portfolio might select a bunch of stocks that have already done well, and then by no surprise of anybody, the returns for those stocks turned out to be great. Here's one example from Value Trap:
---
The PowerShares Multi-Strategy Alternative Portfolio Fund is one such example. According to WealthManagement, the fund was marketed with backfilled data that showed enviable returns. The backfilled returns were so good that if the index had been live, it would have achieved "90 percent of the returns of the S&P 500 with 20 percent of the volatility and a maximum drawdown only 2.4 percent." This would put it among the top 1% of hedge funds during the past 10-year stretch. Since the fund went live in 2014, however, it lost money through 2018, while the S&P 500 advanced. What's worse is that its maximum drawdown was over 15%, more than six times that of how the strategy performed during the worst of times in the backtest, which even included the Financial Crisis. Think about the marketing muscle of having pre-selected data in backtests though.
---
In some ways, it may explain, why passive investing and quantitative strategies have become popular relative to active management, and it may be caused by how performance is marketed to and interpreted by the investor. For starters, it may be impossible for an active manager to theoretically outperform pre-selected backtests (how could they?). If you could imagine an investor deciding between two funds in which to invest. If the investor is presented with backfilled data of one fund versus actual data of another fund, that investor may not know that those comparisons aren't apples-to-apples. In such a case, it's not as simple as selecting the best-performing, risk-adjusted fund based on past data (in fact, you should never do this, as past is not prologue). The attractive characteristics revealed in past backfilled data could be far from predictive of what may happen in the future, perhaps more so than the track record of an active fund with actual results.
---
After I told our story about our experience with celebrity influence, I received an email from a member about the Cramer COVID-19 Broad Index who was very fond of that index's returns. It turns out the index appears to be yet another example of a backfilled index. The index here seems to have been backfilled to the beginning of the year, months before its creation in late April. The index is up 50% from the start of the year, but from the time of its actual creation in late April, it is only up 24%. These types of backfilled indexes, when converted into ETFs or other passive products, are literally killing active management, as its nearly impossible for active managers to beat indexes that are backfilled with known historical information!
---
That said, to my amazement, the equal-weighted hypothetical returns of our top 10 COVID-19 ideas not only exceeded the market return over the simulated measurement period by a huge margin, but because of the impeccable timing of their release, they also did better than the returns of a backfilled index from the start of the year that--get this--was filled with stocks that in April were already "outperforming the S&P 500 since the start of 2020." I sincerely hope this provides some perspective of just how awesome our research and idea generation has been this year. If I had a mic, I would drop it!
---
Kind regards,
---
Brian Nelson, CFA
President, Investment Research
Valuentum Securities, Inc.
brian@valuentum.com
---
It's Here!
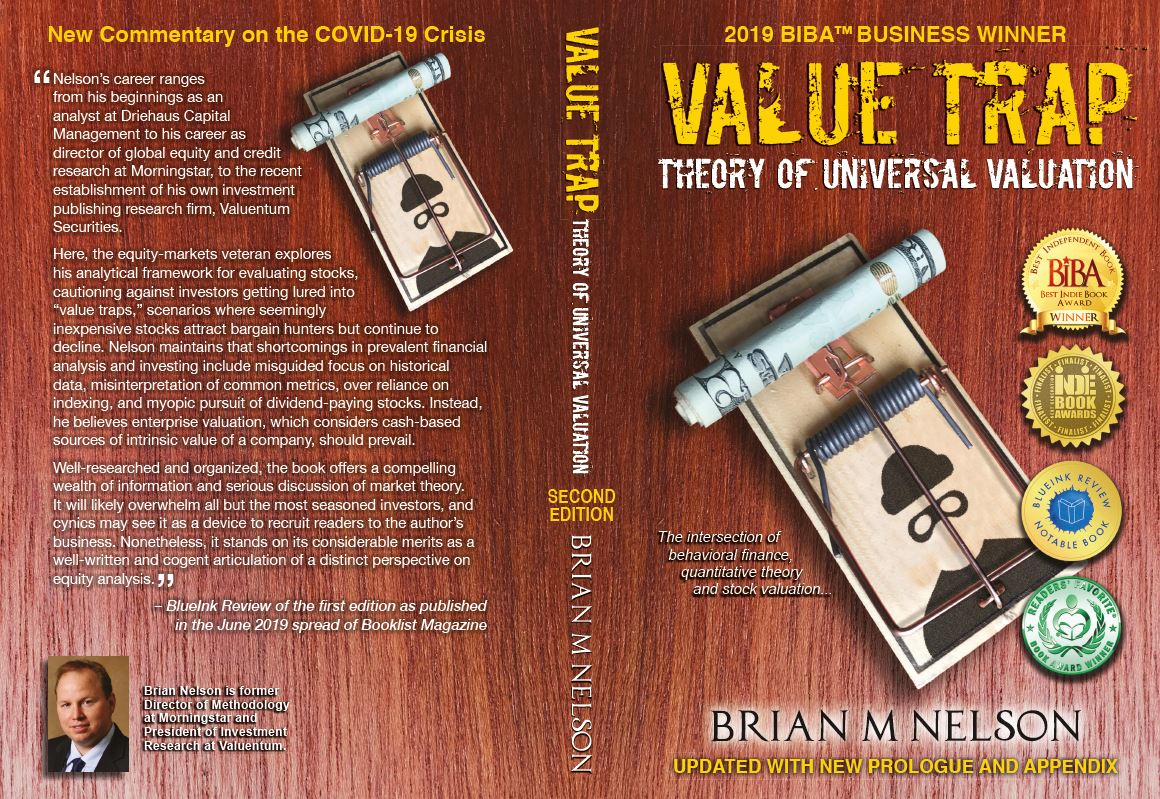
The Second Edition of Value Trap! Order today!
 -----
---
Valuentum members have access to our 16-page stock reports, Valuentum Buying Index ratings, Dividend Cushion ratios, fair value estimates and ranges, dividend reports and more. Not a member? Subscribe today. The first 14 days are free.
---
Brian Nelson owns shares in SPY, SCHG, DIA and QQQ. Some of the other securities written about in this article may be included in Valuentum's simulated newsletter portfolios. Contact Valuentum for more information about its editorial policies.
|


0 Comments Posted Leave a comment