Member LoginDividend CushionValue Trap |
Nike Beats Estimates Aided By Its Omni-Channel Selling Strength
publication date: Jun 25, 2021
|
author/source: Callum Turcan
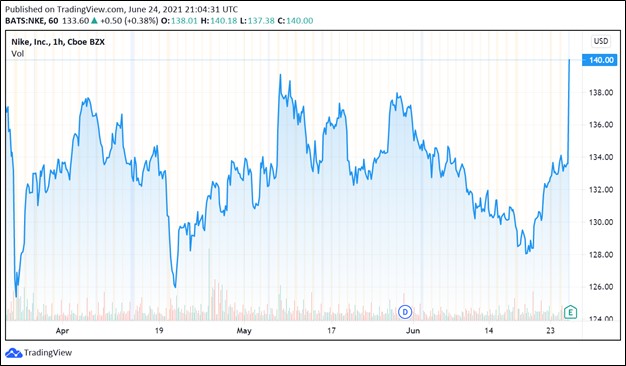
Image Shown: Shares of Nike Inc popped higher after its latest earnings report. By Callum Turcan On June 24, Nike Inc (NKE) reported fourth quarter earnings for fiscal 2021 (period ended May 31, 2021) that beat both consensus top- and bottom-line estimates. Shares of NKE popped higher after the report. The top end of our fair value estimate range for Nike sits at $160 per share, meaningfully above where shares of NKE are trading at as of this writing--even after the latest bounce in its stock price. Earnings Update Keeping in mind that the coronavirus (‘COVID-19’) pandemic creates a lot of noise when it comes to year-over-year comparisons, Nike’s GAAP revenues surged higher 96% year-over-year last fiscal quarter. Nike-branded footwear sales and sales of its Converse products were both up by high-double digits on a year-over-year basis last fiscal quarter, while sales of Nike-branded apparel and equipment were up triple-digits year-over-year last fiscal quarter. The company’s strong sales performance was reflected across all key geographies. Compared to the fourth quarter of fiscal 2019 (period ended May 31, 2019), Nike’s GAAP revenues were up 21% in the fourth quarter of fiscal 2021. NIKE Direct represents the backbone of the firm’s direct-to-consumer (‘DTC’) e-commerce strategy and sales were up 73% year-over-year last fiscal quarter. Please note that in the fourth quarter of fiscal 2020 (period ended May 31, 2020), NIKE Direct sales were up 75% year-over-year, highlighting the company’s sustained momentum on this front. NIKE Direct sales represented over a third of Nike’s revenues last fiscal quarter. We have covered Nike’s digital ambitions numerous times in the past, including in a March 2021 article that can be viewed here, and continue to be impressed with its DTC performance. Nike’s GAAP gross margin surged higher ~850 basis points year-over-year in the fourth quarter of fiscal 2021 and were up ~30 basis points from its performance in the fourth quarter of fiscal 2019. The company’s stellar omni-channel selling capabilities are having a positive impact not only on its sales performance but its profitability performance as well (i.e., stronger gross margins). We appreciate Nike’s strength on this front and the firm is well-positioned to take advantage of the proliferation of e-commerce activities, in our view. At the end of May 2021, Nike had a ~$4.1 billion net cash position (inclusive of negligible short-term debt). Having a pristine balance sheet is an immense source of strength and Nike has ample financial firepower at its disposal. That said, we caution that Nike also has sizable operating lease liabilities to be aware of as well. Nike has grown its dividend over the past 19 consecutive years and shares of NKE yield ~0.8% as of this writing. The company also allocates substantial sums towards share repurchases. Concluding Thoughts Nike did not include its cash flow statement within its latest earnings press release. When the company publishes its Fiscal 2021 Annual Report (10-K SEC filing)--and after we roll our valuation model of Nike forward for the new fiscal year--there is a chance Nike’s fair value estimate may get adjusted. Recently, we covered Lululemon Athletica Inc’s (LULU) latest earnings report that interested members can check out here. As with Nike, Lululemon has done a stellar job building out its omni-channel selling capabilities and, also like Nike, Lululemon has a pristine balance sheet. We are not interested in adding Nike as an idea to any of the newsletter portfolios at this time, though we appreciate its strong performance of late. Nike's 16-page Stock Report (pdf) >>
Nike's Dividend Report (pdf) >> ----- Discretionary Spending Industry - ATVI, BBY, CBRL, CMG, DIS, DG, DLTR, DPZ, DNKN, EL, F, GM, HAS, HD, LOW, MCD, NFLX, NKE, SBUX, TSLA, YUM, DKS, TJX, ROST, WHR, KMX, AZO, RL, ULTA, LEG, GPC, VFC, CTAS, WSM Disruptive Innovation Industry – W, ZM, SPCE, ROKU, WORK, MNST, SAM, SPLK, PENN, VRSK, ICE, LULU, ETSY, DOCU, UBER, BYND, SFIX, CVNA, TER, GPN, PANW, VRSN, MELI, FSLR, JD, CRSP, PINS, NDAQ, FVRR, SNAP, GME, CROX, NOW Tickerized for PTON, NKE, UA, UAA, ADDYY, ADDDF, DECK, CROX, SKX, SHOO, LULU, GOOS, ELY, GOLF, FL, JDSPY, JDDSF, SCVL, DKS, HIBB, BGFV, MSGN, MSGS, BATRA, MANU, MVP, FXI, MCHI Valuentum members have access to our 16-page stock reports, Valuentum Buying Index ratings, Dividend Cushion ratios, fair value estimates and ranges, dividend reports and more. Not a member? Subscribe today. The first 14 days are free. Callum Turcan does not own shares in any of the securities mentioned above. Chipotle Mexican Grill Inc (CMG), Dollar General Corporation (DG), Domino's Pizza Inc (DPZ) and The Walt Disney Company (DIS) are all included in Valuentum’s simulated Best Ideas Newsletter portfolio. Dick’s Sporting Goods Inc (DKS) and Home Depot Inc (HD) are both included in Valuentum’s Dividend Growth Newsletter portfolio. Some of the other companies written about in this article may be included in Valuentum's simulated newsletter portfolios. Contact Valuentum for more information about its editorial policies.
|


1 Comments Posted Leave a comment