Member LoginDividend CushionValue Trap |
I Don’t Know How Lucky I Am, Do You?
publication date: Oct 26, 2021
|
author/source: Brian Nelson, CFA
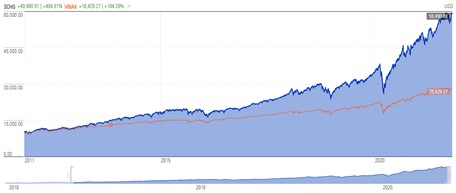
Image: The category of large cap growth (SCHG) has outperformed a 60/40 stock/bond rebalanced portfolio (VBIAX) by ~310 percentage points the past 10 years. Image Source: Morningstar. By Brian Nelson, CFA Hi everyone. I hope you all are doing well. It’s been a while since I wrote a personal message, but today, I thought it would be worthwhile to share my ever-evolving opinion on the world of financial markets. First, let me start with Facebook (FB). Hopefully, I set your expectations very low for the social media giant’s third-quarter report because this one is a long-term holding. Shares are dirt cheap, and while sentiment has moved against it, we’re going to “hold” strong in the Best Ideas Newsletter portfolio (1). Alphabet’s (GOOG) shares are indicated down after the market close October 26, but as we dig into its third-quarter report, both the company’s top- and bottom-lines came in better than expected. We like Alphabet and think shares remain severely undervalued (2). It may capture some dollar flow as it doesn’t quite have as much “hair” on it as Facebook. Visa (V) is indicated slightly lower after hours on a fiscal fourth-quarter report that showed revenue and non-GAAP earnings per share exceeding the consensus figure. As with both Facebook and Alphabet, Visa’s shares are trading below our fair value estimate. We view Facebook, Alphabet and Visa as the stalwarts of the Best Ideas Newsletter portfolio. It would take a near-apocalypse for us to grow negative on these moaty enterprises. These three entities combined account for between 24%-30% of the Best Ideas Newsletter portfolio and have for some time. Through the close today, October 26, Facebook has advanced ~17.4% year-to-date, Visa has advanced ~6.5% year-to-date, while Alphabet has advanced ~61.6% year-to-date. That means that 24%-30% of the simulated Best Ideas Newsletter portfolio, among the highest weighted ideas, put up an average return of ~28.5% versus an S&P 500 (SPY) advance of 23.6%. In light of the number of permutations that one can have with respect to the average weightings across the simulated newsletter portfolios, measuring hypothetical performance has become less of a priority for us than delivering great ideas that build long-term wealth, income, and dividend growth potential via stock selection. As my views have advanced over the years, I have come to realize that most of the financial discipline has painted itself into a corner, and it likely has to do with my alma mater, Morningstar (MORN), perhaps more than any other company. The fund star rating system may have truly warped the investor mindset. Let me explain because I have fallen into this trap, too. Let’s say, you read from S&P Global (SPGI) or Morningstar that ~90% of large cap managers have trailed their benchmarks during the past 15 years. You might conclude that stock selection is no good, and default to some of the traditional asset allocation techniques out there that use indexing. So, with this knowledge that stock selection is impossible (even the experts can’t do it), you decide to build a nice portfolio of stocks and bonds and maybe some alternative assets--perhaps for simplification, let’s just say a 60/40 stock/bond split. During the past 10 years, however, this strategy has fallen behind a simple indexed equity portfolio and far behind exposure to large cap growth. But what do these purveyors of the 60/40 life do? They continue to bash active stock selection, even though they are doing far worse than most active managers, themselves. There are two things happening: 1) these investors are not comparing active stock selection as a risk strategy in the same vein as asset allocation, and 2) these investors are succumbing to holdings-based analysis (a 4-star ETF in one category could be better than a 4-star fund in another category, in my view, as I will talk about later). For example, how many investors would have been far better off had they just held a large cap growth fund than if they had rebalanced a 60/40 stock/bond portfolio? I’d say almost all of them. According to data from Morningstar, a hypothetical $10,000 investment in large cap growth (the 4-star rated ETF, Schwab U.S. Large-Cap Growth ETF, SCHG) advanced to $59.490.91 while the 60/40 stock/bond rebalanced portfolio (the Vanguard Balanced Index, the VBIAX) advanced to just $28,429.27. That’s ~310 percentage points. Large cap growth is far from ultra-speculative stocks either. The category includes many of our favorites as top holdings, including the aforementioned FB, GOOG, and V. But let’s say you didn’t pick large cap growth exposure and instead, all you were able to do was match the S&P 500 (the 4-star rated ETF, SPY), well then you would have outdistanced the 60/40 stock/bond rebalanced portfolio by ~165 percentage points. So tell me – how could an industry scare investors away from building diversified portfolios of stocks and still sleep at night? I won’t go into the reasons why, but the case remains: if all you did was focus on stock selection the past 10 years, and let’s say you even did worse than the SPY’s performance, as long as you didn’t trail it by ~165 percentage points or more, you’re actually doing great. I truly mean that. But here’s the real kicker, and I’m sure my advisor friends reading this will agree because many of them are putting in the stock-selection work. What if you had paid a financial advisor 1%/year during the past 10 years to just rebalance a 60/40 stock/bond portfolio. Well, you can do the math factoring in the extra fees, but the comparison doesn’t get better. The comparison between selecting stocks and building a diversified portfolio of equities just makes a whole lot of sense, in my view. Why are companies like Morningstar and S&P Global scaring investors away from stock selection with these money manager holdings-based studies? You may think I’ve overlooked the key importance of risk management. Well, I haven’t, and that’s why I’m not a fan of indexing. For example, one could have said, “hindsight is 20/20” with these comparisons, but that’s what makes them so relevant. Active stock selection is risk management relative to “blind” indexing, and if you’re able to pick stocks that stack up to the returns of the SCHG and SPY, you have better risk-adjusted returns than the indexer that matched your performance, in my view, and you're doing far better than an indexer that has a lower percentage of equities in the portfolio than you – and arguably much better than that same indexer that invested in 100% equities but chose to allocate to small cap value and international stocks. It’s somewhat ironical to me. Investors tend to shy away from the rigors of technical analysis, which examines chart moves and volatility, but somehow the statistical measures of chart movements have made their way into the financial curriculum, as a measure of risk (e.g. risk-adjusted returns). You and I both know that volatility is not a good measure of risk. Upside volatility, for one, is exactly what we’re shooting for with respect to investing! Here’s how I see the reality. If after seeing these performance numbers, you don’t see the value in selecting stocks for yourself or for your clients, you’re buying into the arguments that indexers love to use. Why should you care, for example, if you’ve underperformed the large cap growth benchmark or the S&P 500 when you’ve done far better than those employing “di-worsification” into bonds, small cap value or international equities (and paying huge fees on top of it). Sometimes, I get beat up over a stock idea not outperforming or the simulated newsletter portfolios hitting a rough patch, and it’s hard to stomach. Sometimes, I sit in frustration because I know how others are “playing the game,” and how lucky I am to be a stock picker. Quite simply, if you’ve been picking stocks the past 10 years and didn’t fall into the quant value trap of small cap value, it’s very likely you’ve hit the ball out of the park relative to what you might have ended up with had you gone with a sophisticated asset allocation model with management fees. I hope you can see how lucky you are, too. Thank you so much for being here. Stocks for the long haul! (1) https://www.valuentum.com/articles/facebooks-thirdquarter-2021-results-better-than-feared (2) https://www.valuentum.com/search2?searchtext=goog&searchtype=symbol (3) https://www.valuentum.com/search2?q=fb&searchtype=symbol&btn=Search -----
Image Source: Value Trap ---------- Valuentum members have access to our 16-page stock reports, Valuentum Buying Index ratings, Dividend Cushion ratios, fair value estimates and ranges, dividend reports and more. Not a member? Subscribe today. The first 14 days are free. Brian Nelson owns shares in SPY, SCHG, QQQ, DIA, VOT, BITO, and IWM. Valuentum owns SPY, SCHG, QQQ, VOO, and DIA. Brian Nelson's household owns shares in HON, DIS, HAS. Some of the other securities written about in this article may be included in Valuentum's simulated newsletter portfolios. Contact Valuentum for more information about its editorial policies. |


2 Comments Posted Leave a comment