
Member LoginDividend CushionValue Trap
|
Dividend Cushion Ratio Predicts Two More Cuts
publication date: Jul 23, 2015
|
author/source: Kris Rosemann
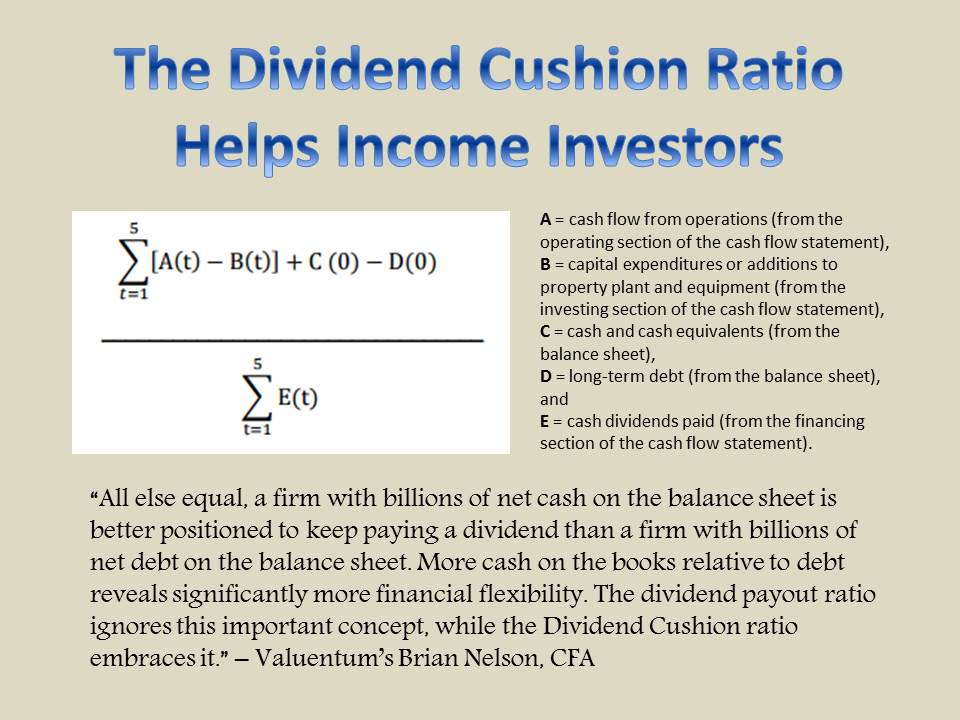
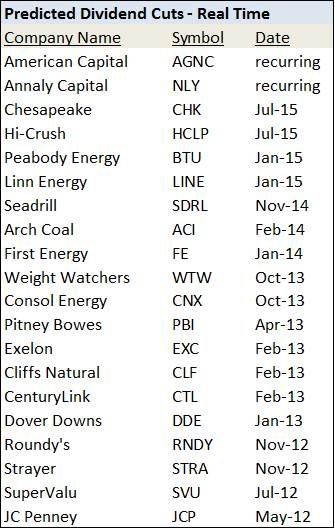
Early in July and prior to the elimination of its dividend, Chesapeake Energy ranked near the top of our list of dividend yields to avoid. Based on its Dividend Cushion ratio of -7.7, we rated its dividend safety as VERY POOR, and its dividend growth potential rating was also VERY POOR. The firm updated its financial strategy July 21 and eliminated its common stock dividend, effective in the third quarter of 2015. A reduction in investable capital due to the weak commodity price environment for oil and natural gas has caused the firm to reallocate the cash planned for use on dividend payouts into its 2016 capital program. Free cash flow has been a major issue for Chesapeake; only twice in the past two decades has the company reported positive free cash flow. Though it was material enough to be acknowledged by the Dividend Cushion, the cash flow situation at Hi-Crush was not as dire as at Chesapeake Energy. Prior to cutting its quarterly distribution by ~30%, Hi-Crush had a Dividend Cushion ratio of 0.9, or a dividend safety rating of POOR. The firm’s dividend growth potential received a rating of VERY POOR as measured by its Dividend Cushion and the company’s dividend track record. Soft market conditions in the sand industry have weakened cash flows and are expected to continue into 2016. Management claimed that it could continue to pay the distribution at its previous level with cash from its balance sheet, but it feels that preserving capital and investing in the company are more sensible at this time. The Dividend Cushion ratio agrees. What sets our dividend analysis apart from others is the fact that the Dividend Cushion ratio uses our projections of a firm’s future free cash flows to assess future dividend potential, while the majority of other dividend analysis is backward-looking. A firm’s dividend track record is useful in assessing a management team’s willingness to raise distributions to shareholders, but the capacity of a company to keep raising the dividend is also an important consideration. This is why a forward-looking, cash flow based dividend analysis often trumps backward-looking assessments, and the very reason why our Dividend Cushion ratio has done an excellent job catching those who have reached dangerous payout levels. Stay tuned for more dividend analysis. |

 Forward-looking, cash-flow based dividend analysis has proven its worth once again. Chesapeake Energy (