Member LoginDividend CushionValue Trap
|
American Express Charges Ahead, Discover's Shares Look Cheap
publication date: Apr 18, 2018
|
author/source: Kris Rosemann
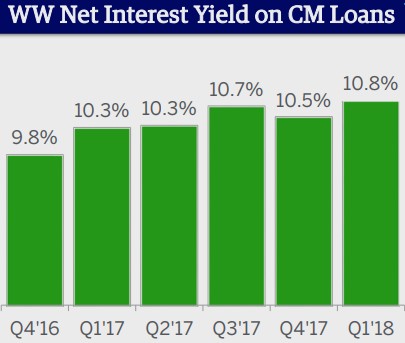
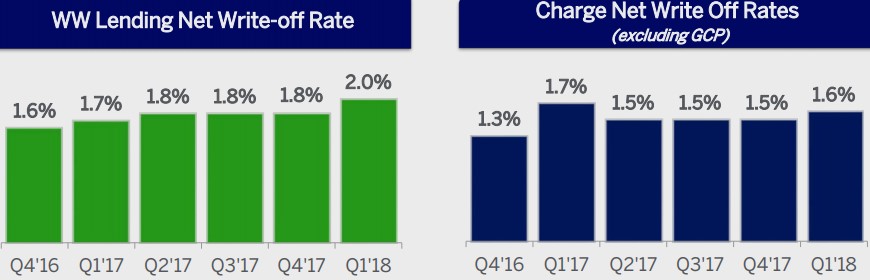
Image Source: Philip Taylor By Kris Rosemann American Express delivered strong first quarter results as it begins to transition from its unique spend-centric business model. American Express’ (AXP) first quarter 2018 results, released after the close April 18, impressed investors, and shares moved higher immediately following the report. The strong quarter kicks off the beginning of a year in which management plans to adjust its strategy, which has historically placed more emphasis on charging merchant fees on transactions using its cards ahead of charging interest on credit card balances. The company plans to cut merchant fees by 5 to 6 basis points in 2018 in an attempt to grow acceptance and drive volumes, and it is also working to grow its lending operations. Total revenues net of interest expense at American Express advanced 12% in the quarter on a year-over-year basis thanks to higher Card Member spending, loans, and fee income. Card Member spending advanced 12%, and the company acquired 3.5 million new cards across its global issuing business thanks in part to its acquisition of the Hilton (HLT) card portfolio. American Express’ international consumer and commercial were key drivers of worldwide billed business growth of 10% in the quarter. Its loan portfolio grew 16% from the year-ago period, and management continues to believe it has a solid handle on credit indicators as it grows its loan portfolio. Provisions for losses climbed 35% in the first quarter of 2018 from the comparable period of 2017, which was in line with management’s expectations, due to the increase in its loan portfolio as well as an increase in lending write off and delinquency rates. Worldwide net interest yield improved 50 basis points from the first quarter of 2017 to 10.8%, but monitoring consumer credit profiles will become more meaningful as American Express grows its loan portfolio. American Express’ worldwide lending net write-off rate grew 30 basis points to 2% in the first quarter, but charge net write off rates (excluding Global Corporate Payments) fell to 1.6% from 1.7%.
Image source: American Express first quarter earnings presentation American Express’ net income leapt an impressive 31% in the first quarter on a year-over-year basis as revenue growth outpaced consolidated-expenses growth of 9%, the latter of which was driven by growth in rewards expenses as well as expenses related to increased Card Member spending, higher usage of card benefits, and ongoing investments in cobranded partnerships. Investors should note that a portion of the increase in net income came from a lower effective tax rate, which fell to 22% from 32% in the first quarter of 2017. Looking ahead to the full year 2018, management is confident in the momentum in its business and expects revenue growth to come in at 8% over 2017. Earnings per share guidance for the year comes in a range of $6.90-$7.30, and both guidance measures suggest the first quarter of 2018 may be strongest of the year as revenue growth and earnings per share came in at 12% and $1.86 (annualizes to $7.44)--or a more conservative yearly target. We think the latter. In any case, management’s expectations signal strength in its business, and we like to see the continued momentum as the company tweaks its underlying strategy. Shares of American Express are trading roughly in line with our current fair value estimate of $100 per share as of this writing, and the midpoint of management’s guidance implies shares are changing hands at less than 14 times 2018 earnings. Shares currently yield ~1.5%. Discover Financial's Shares Look Really Cheap American Express’ rival Discover Financial Services (DFS) has also done a nice job of growing its loan portfolio as it works to maintain a focus on prime credit customers. Discover’s loan portfolio is slightly larger than American’s ($84.2 billion at the end of 2017 for Discover compared to $75.8 billion for American Express at the end of the first quarter of 2018), but its net charge-off rate is also higher and jumped to 2.7% in 2017 from 2.16% in 2016. The two companies had comparable interest yields as of the end of 2017, with American’s 10.5% interest yield in the fourth quarter of 2017 slightly ahead of Discover’s 10.28% net interest margin on receivables. However, Discover’s loan growth is expected to decelerate to a range of 7%-9% in 2018 from 9% in 2017, and its total net charge off rate is expected to grow to a range of 3.0%-3.25% due to ongoing supply driven credit normalization and the maturation of its growing loan portfolio. Management was quick to note that the overall consumer credit environment should remain constructive, a factor that bodes well for both Discover and American Express. While encouraging, these comments may be at odds with the fact that US credit card debt at the end of the third quarter of 2017 was $808 billion, or $280 billion higher than the previous record high that came at the height of the Great Recession. Some estimates peg this number as having already reached the $1 trillion mark in early 2018. We’re not sounding the alarm with respect to consumer credit health at this juncture as the US economy continues to power ahead, but the growing number, as well as other credit metrics, is worth keeping an eye on, especially as it relates to the health of Discover and American Express. Shares of Discover are trading at ~9.3 times consensus estimates for 2018 earnings as of this writing and well below our current fair value estimate of $102 per share. Shares currently yield ~1.95%. ----- Valuentum members have access to our 16-page stock reports, Valuentum Buying Index ratings, Dividend Cushion ratios, fair value estimates and ranges, dividend reports and more. Not a member? Subscribe today. The first 14 days are free.
Kris Rosemann does not own shares in any of the securities mentioned above. Some of the companies written about in this article may be included in Valuentum's simulated newsletter portfolios. Contact Valuentum for more information about its editorial policies. |