Member LoginDividend CushionValue Trap |
3 Dividend Growth Stocks For The Long Run
publication date: Nov 29, 2023
|
author/source: Brian Nelson, CFA
By Brian Nelson, CFA We think stocks with a strong net cash position on the balance sheet and generate tremendous amounts of free cash flow have the greatest likelihood to achieve long-term capital appreciation. Net cash is an addition to the present value of future expected free cash flows within the discounted cash-flow valuation method. If future expectations of free cash flow increase, so should the stock price, all else equal. On the other hand, if future expectations of free cash flow decrease, the stock price should fall, all else equal. Focusing on the cash-based sources of intrinsic value -- net cash and future expectations of free cash flow -- is simply par for the course and cuts through the qualitative to get right to the cash components of the business. A lot of investors believe, for one reason or another, that the dividend is a driver behind a company's valuation. Whether it is the card in the game Monopoly (where players get money from the "bank"), the application of dividend discount models in introductory finance, or skepticism that the dividend is capital appreciation that otherwise would have been achieved had the dividend not been paid -- or a combination of all three -- the love for dividends is nonetheless tightly held by many. The last of these three dynamics is often the most difficult to explain, but it's so important to add back dividends to capital appreciation to arrive at total return. Had the company not paid those dividends, capital appreciation would have been much higher, all else equal. The dividend is not independent of the stock price, as explained in the free dividends fallacy.
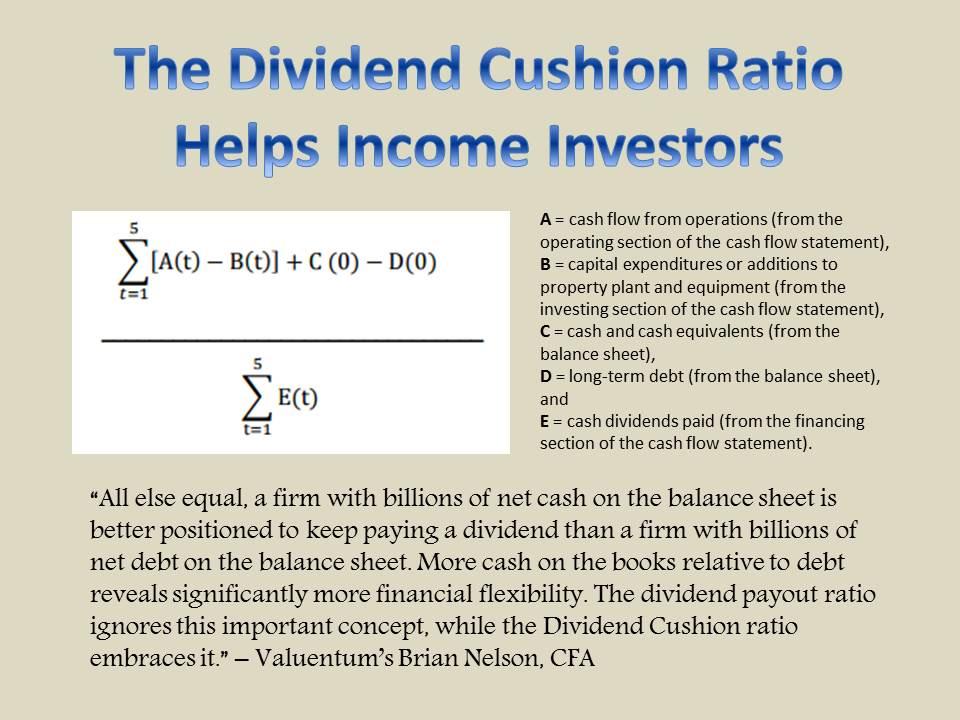
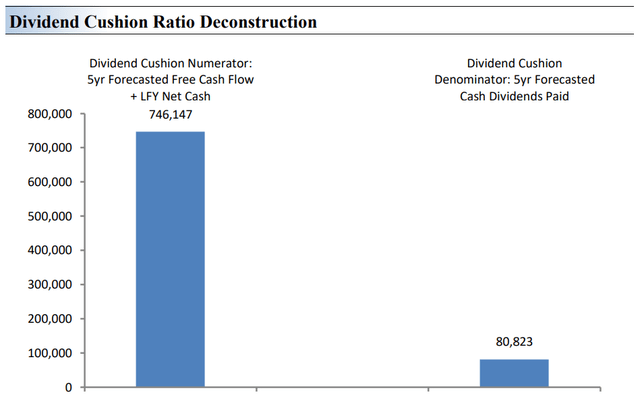
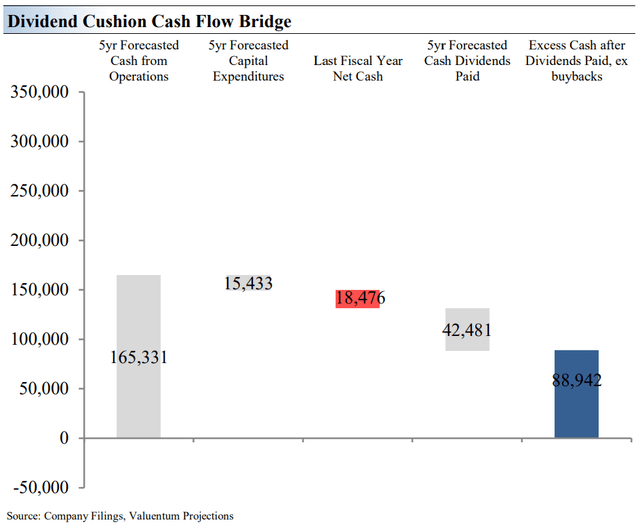
The Dividend Cushion Ratio Helps Income Investors (Valuentum) With this in mind, when it comes to our dividend growth ideas, we like to focus on those that have great total return prospects first, and then progress to the dividend analysis through the lens of the Dividend Cushion ratio. As you can probably imagine, our dividend analysis is laser-focus on the cash components the business -- net cash on the balance sheet and future expectations of free cash flow. All else equal, a company with tremendous net cash on the balance sheet has significantly more financial flexibility to grow the payout or issue a special dividend than a company with a huge net debt position. A focus on free cash flow is a much better indicator of a company's cash coverage of the payout than the application of the dividend payout ratio, which uses accounting earnings that may not capture the cash inflows and outflows of the enterprise. Here are three stocks that we like for total return that also have strong dividend growth prospects. Apple (AAPL)Apple has an incredibly valuable brand, giving it a material competitive advantage via a halo effect. Almost every new product it has produced has been embraced by its entrenched installed base, which continues to grow. What it has developed via its ecosystem and the presence it has in the everyday lives of consumers gives it one of the strongest economic moats, in our view. A core component of of our thesis on Apple, and its dividend strength is its massive net cash position. Though Apple is targeting a net-neutral balance sheet in time, the company's tremendous free cash flow generation allows such a position to remain impressive while continuing to pay out a growing dividend. Apple has averaged ~$101.3 billion in free cash flow from fiscal 2021-2023, well in excess of annual run-rate cash dividend obligations of ~$15 billion. Apple's Dividend Cushion ratio stands at an enviable 9.2. Shares yield ~0.5% at the time of this writing. The Dividend Cushion Ratio Deconstruction reveals the numerator and denominator of the Dividend Cushion ratio. At the core, the larger the numerator, or the healthier a company's balance sheet and future free cash flow generation, relative to the denominator, or a company's cash dividend obligations, the more durable the dividend. In the context of the Dividend Cushion ratio, Apple's numerator is larger than its denominator suggesting strong dividend coverage in the future. The Dividend Cushion Ratio Deconstruction image puts sources of free cash in the context of financial obligations next to expected cash dividend payments over the next 5 years on a side-by-side comparison. Because the Dividend Cushion ratio and many of its components are forward-looking, our dividend evaluation may change upon subsequent updates as future forecasts are altered to reflect new information. (Valuentum) Microsoft (MSFT)We like to evaluate the safety of a company's dividend by adding the company's net cash to our forecast of the firm's free cash flows over the next five years. As we have explained in prior notes, we then divide that sum by the total expected dividends over the next five years. This process results in the Dividend Cushion ratio. A Dividend Cushion ratio above 1 indicates a company can cover its future dividends with net cash on hand and future free cash flow, while a score below 1 signals trouble may be on the horizon. The Dividend Cushion ratio can also be viewed much like a corporate credit rating, whereupon the higher the ratio (credit rating) the lower the probability of a dividend cut (default). Microsoft registers an impressive 3.8 on our Dividend Cushion metric, which is excellent. Looking across all of our coverage universe, Microsoft has had one of the most attractive dividend growth profiles. The software giant boasts an impressive balance sheet with a strong net cash position, inclusive of short-term debt. Although the firm's proposed deal for Activision (ATVI) may change the make-up of its balance sheet in coming years, we're not too worried about the deal's implications on Microsoft's long-term dividend health. Its purchase of LinkedIn years ago has been positive, helping to expand its addressable market as well as drive engagement across its many platforms. Microsoft is in the midst of continuing to drive adoption of cloud-based software products and has an enviable position in the potential for artificial intelligence via its stake in ChatGPT. Shares have been doing extremely well of late and yield ~0.8% at the time of this writing. UnitedHealth Group (UNH)As we've explained in prior notes and repeated in part for the convenience of readers in this article, the Dividend Cushion Cash Flow Bridge, shown in the image that follows, depicts what drives the Dividend Cushion ratio. UnitedHealth Group's Dividend Cushion Cash Flow Bridge (image below) reveals that the sum of the company's 5-year expected cumulative free cash flow generation, as measured by cash flow from operations less all capital spending, and its net cash/debt position on the balance sheet, as of the last fiscal year, is greater than the sum of the next 5 years of expected cash dividends paid. Such analysis helps reveal whether there will be a cash surplus or a cash shortfall at the end of the 5-year period, taking into consideration all of the leverage on a company's balance sheet, a key source of risk. As we have written before, it is our belief that dividend growth stocks that have a strong net cash position on the balance sheet and are generating a lofty amount of free cash flow are better able to pay and grow their payouts year after year. On the other hand, entities with a large amount of net debt on their balance sheets while failing to sufficiently cover their dividend with free cash flow are more at risk of a dividend cut or a suspension of growth, all else equal, in our opinion. Generally speaking, the greater the 'blue bar' to the right is in the positive in the image below, the more durable a company's dividend. On the other hand, the greater the 'blue bar' to the right in the image below is in the negative, the less durable a company's dividend, in our view. UnitedHealth's Dividend Cushion ratio is quite healthy at 3.1, and its 'blue bar' is solid, by our estimates. Shares yield ~1.4% at this time. Dividend Cushion Cash Flow Bridge (Valuentum) Concluding Thoughts
We think dividend growth investors should focus on total return first, and then move on to the evaluation of a company's dividend health. We believe that total return is a function of a company's net cash position and future expectations of free cash flow, and in this article, we have highlighted three strong, net-cash-rich, free cash flow generators that also have increased their dividends consistently over the years. Though these names are not hidden by any stretch, the strong performance of the Magnificent 7 reveals that investors don't need to look very far to find some of the best-performing ideas. Make sure that you know the Dividend Cushion ratio for companies in your dividend growth portfolio! ---------- It's Here!
The Second Edition of Value Trap! Order today!
 -----
Brian Nelson owns shares in SPY, SCHG, QQQ, DIA, VOT, BITO, RSP, and IWM. Valuentum owns SPY, SCHG, QQQ, VOO, and DIA. Brian Nelson's household owns shares in HON, DIS, HAS, NKE, DIA, and RSP. Some of the other securities written about in this article may be included in Valuentum's simulated newsletter portfolios. Contact Valuentum for more information about its editorial policies. Valuentum members have access to our 16-page stock reports, Valuentum Buying Index ratings, Dividend Cushion ratios, fair value estimates and ranges, dividend reports and more. Not a member? Subscribe today. The first 14 days are free. |


0 Comments Posted Leave a comment