
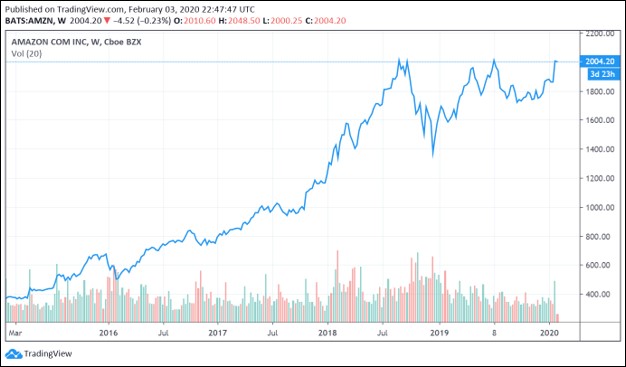
Image Shown: After reporting fourth quarter earnings for 2019, shares of Amazon Inc have returned to their 2018 highs as of this writing.
By Callum Turcan
On January 30, Amazon Inc (AMZN) reported fourth-quarter earnings for 2019 that handily beat consensus expectations. Shares of AMZN are now trading back near their highs first reached in 2018. We like Amazon’s growth trajectory but don’t include Amazon in our newsletter portfolios due to the enormous uncertainty in the company’s key valuation drivers, which has a magnified impact on changes in its fair value estimate. That’s a product of its high operating leverage. Even a ~50 basis point difference in its expected gross margins versus its realized gross margins, for example, could have a profound impact on its intrinsic value and ultimately share price performance. Our fair value estimate sits at $1,972 per share of Amazon, and our fair value estimate range sits at $1,479-$2,465 per share.
Valuation Overview
In the graphic below, from our 16-page Stock Report (can be accessed here), we showcase why there’s so much uncertainty in Amazon’s fair value estimate range. For starters, under the pessimistic (but still reasonable) scenario, our models forecast Amazon could generate ~$37.8 billion in free cash flow in fiscal 2023. Under the optimistic (but still reasonable) scenario, our models forecast Amazon could generate ~$70.1 billion in free cash flow in fiscal 2023. That kind of uncertainty doesn’t fit in with Valuentum’s methodology, where we seek to locate high quality equities trading well below their fair value estimate during times where shares have a high probability of converging towards their intrinsic value in the foreseeable future (that’s where technical performance really comes in).
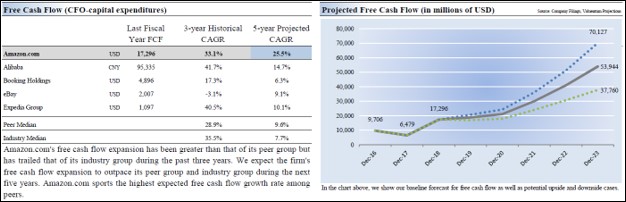
Image Shown: Small changes in key valuation assumptions can have a profound impact on the intrinsic value of a company. For instance, if Amazon’s marketplace service generates gross margins that just mildly differ (let’s say ~25-75 basis points) from the market consensus, due to the firm’s high operating leverage that would have a large impact on its actual or realized future free cash flows. For that reason, we tend to stay away from companies where their key valuation assumptions have a lot of volatility built in them.
In the graphic below, also from our 16-page Stock Report, we cover our base case assumptions for Amazon that we use in our models. Please note the average EBIT margin of 6.6% during the five-year projection period (Year 0 to Year 5), which if adjusted even slightly, can have a profound impact on Amazon’s estimated intrinsic value.
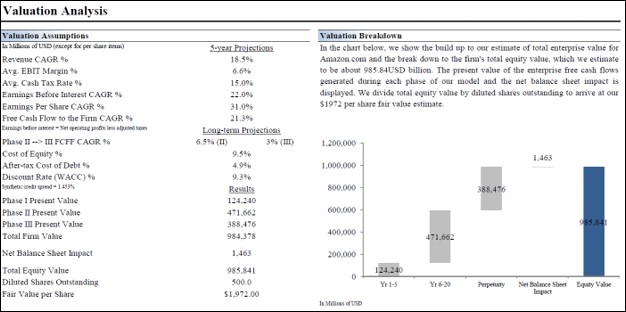
Image Shown: An overview of the key valuation assumptions used in our models covering Amazon, specifically as it relates to our base case scenario.
Financial Overview
In 2019, Amazon generated $280.5 billion in GAAP revenue which was up over 20% year-over-year. That kind of top-line growth is likely why shares of Amazon have returned to highs first reached in 2018 as of this writing. Amazon’s marketplace segment performed well, and additionally revenue growth was supported by rising Amazon Web Services (‘AWS’) sales which were up 37% on an annual basis in 2019. Rising advertising sales are also key, which includes various types of digital advertising services (display, sponsored, and video ads). Amazon classifies its advertising-related sales under its ‘Other’ segment, and that segment’s sales have grown from $4.7 billion in 2017 to $10.1 billion in 2018 to $14.1 billion in 2019.
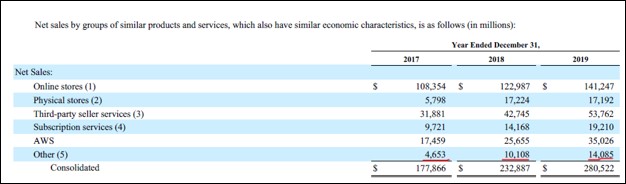
Image Shown: A look at Amazon’s rising top-line, with its ‘Other’ segment revenues (which are largely comprised of its advertising business sales) underlined in red. Image Source: Amazon – 2019 Annual Report with additions from the author
Amazon’s GAAP operating income climbed higher 17% year-over-year in 2019 as its total GAAP operating expenses rose due to a litany of factors (marketing expenses were up 37% year-over-year, fulfillment expenses rose due to rising marketplace sales). A rising headcount was key here, as Amazon employed 647,500 full-time and part-time employees at the end of 2018 which rose to 798,000 at the end of 2019. Considering Amazon is still very much in growth mode, this is to be expected.
During 2019, Amazon generated $38.5 billion in net operating cash flow (up 25% year-over-year) while spending $16.9 billion on capital expenditures (up 26% year-over-year). Free cash flows of ~$21.7 billion were largely added to the balance sheet. Amazon exited 2019 with $36.1 billion in cash and cash equivalents along with $18.9 billion in marketable securities, versus $24.4 billion in long-term debt with no short-term debt on the books. From the end of 2018 to the end of 2019, Amazon’s net cash position grew from $17.8 billion to $31.6 billion.
Amazon gave out guidance for the first quarter of 2020 during its latest earnings report, noting that:
Net sales are expected to be between $69.0 billion and $73.0 billion, or to grow between 16% and 22% compared with first quarter 2019. This guidance anticipates a favorable impact of approximately 5 basis points from foreign exchange rates.
Operating income is expected to be between $3.0 billion and $4.2 billion, compared with $4.4 billion in first quarter 2019. This guidance includes approximately $800 million lower depreciation expense due to an increase in the estimated useful life of our servers beginning on January 1, 2020.
This guidance assumes, among other things, that no additional business acquisitions, investments, restructurings, or legal settlements are concluded.
The expected ongoing double-digit growth in its top line is likely what won over investors, as its operating income will remain under pressure from rising expenses (even after considering the aforementioned favorable impact to part of its deprecation expense).
However, we caution that like all companies, Amazon is closely monitoring the ongoing coronavirus epidemic in China which could have a large impact on its near- and medium-term performance should the global economy slow down significantly (we covered the situation in more detail here). Please note that while Amazon does not generate a meaningful amount of revenue in China, there are dynamic effects to consider here as it relates to Japan, North America, and Western Europe where Amazon does generate an enormous amount of its sales.
Concluding Thoughts
We respect Amazon’s strong fundamental performance, but don’t intend on adding shares of AMZN to our newsletter portfolios at this time. While shares of Amazon are trading near all-time highs and are supported by favorable technicals of late, we see better and more straight-forward opportunities out there (with less volatility in their key valuation drivers) which members can view in our Best Ideas Newsletter portfolio (link here) and Dividend Growth Newsletter portfolio (link here). To read more about Valuentum’s methodologies, we encourage members to check out our book Value Trap (link here).
Internet Content and Catalog Retail Industry – BABA AMZN BKNG EBAY EXPE GRPN IAC OSTK QRTEA STMP
Software Industry – ADBE ADSK EBIX INTU MSFT ORCL CRM
Related: GOOG, GOOGL
—–
Valuentum members have access to our 16-page stock reports, Valuentum Buying Index ratings, Dividend Cushion ratios, fair value estimates and ranges, dividend reports and more. Not a member? Subscribe today. The first 14 days are free.
Callum Turcan does not own shares in any of the securities mentioned above. Microsoft Corporation (MSFT) and Oracle Corporation (ORCL) are both included in Valuentum’s simulated Dividend Growth Newsletter portfolio. Alphabet Inc (GOOG) Class C shares and Booking Holdings Inc (BKNG) are both included in Valuentum’s simulated Best Ideas Newsletter portfolio. Some of the other companies written about in this article may be included in Valuentum’s simulated newsletter portfolios. Contact Valuentum for more information about its editorial policies.