
By Brian Nelson, CFA
Every day we think about how we can make things easier for our members.
Instead of having to visit multiple links on our website with screens, you now have access to one downloadable Excel file where you can sort and rank how you wish. Of course, you can always find those screens in the newsletters, each and every month, too, but we think a weekly data download is a huge value add to our offering. Can you imagine getting updated data every week for 52 weeks of the year for what we charge, let alone two newsletters, hundreds of reports, commentary, and education material? Wow, right? People keep saying we do too much, but when our members’ money is on the line, we don’t think that is possible.
We think we also made a huge step forward when it comes to showcasing just how proficient our stock selection can be. Every person has different goals and different risk tolerances, so where before in the simulated newsletter portfolios, we would outline the specific percentage weighting, we think providing ranges make much more sense. For example, depending on someone’s risk tolerances, a larger cash position in an overheated market may be prudent. On the other hand, the longer one’s time horizon, perhaps a smaller cash position may make more sense. This isn’t for us to decide, and frankly, we want to be relevant for as many as we can in the investment community because we think we have something for everyone! The simulated newsletter portfolios are found in each newsletter.
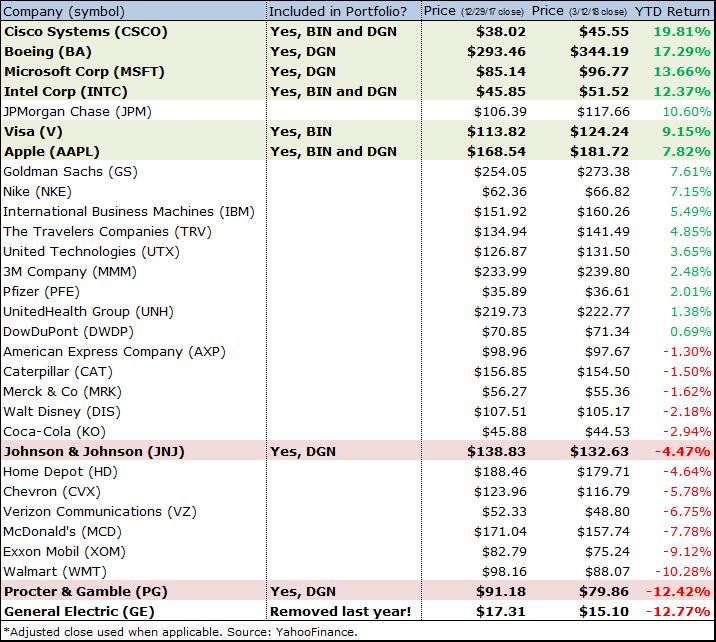
But how have some of the ideas in the simulated newsletter portfolios performed? After all, who cares how much work we do or how much we write, if our process isn’t bearing fruit, right? We’ve done multiple tests on our methodologies in the past, and we’ve been mighty pleased with their findings, but let’s keep things very simple to provide perspective of just how much value we are adding. Year-to-date, in the simulated Best Ideas Newsletter portfolio and simulated Dividend Growth Newsletter portfolio, we’ve “picked” 6 out of the top 7 performers in the Dow Jones Industrial Average so far in 2018! We’ve had some missteps with a couple, but we also removed the worst performer in the Dow Jones Industrial so far in 2018 last year! To an experienced investment professional, the sorting should be viewed as amazing, particularly when you look at our track record.
We just keep delivering.
Of course I don’t want to toot our own horn, but were you aware of how good our ideas have been so far this year? Admittedly, it’s not always easy to see just how solid our stock-selection process is, so we have to publish pieces like this. Sure, we’re not going to get everything right, but my goodness, I really don’t think others can do better. If you’re using a stock-selection analytical service at all, and Valuentum is not on your list, add us, even if we’re your third or fourth opinion. Simply put, we have something special going on here, and we want you to notice it!
I hope you understand we can’t always be quiet because others are out there screaming for your attention. Seriously, if these “picks” were all we did in 2018…that would be amazing. But you know we do much, much more.
Download the March edition of the Dividend Growth Newsletter here (pdf).
Download the February edition of the Best Ideas Newsletter here (pdf).
The March edition of the Best Ideas Newsletter will be released to members March 15.
Tickerized for components in the Dow Jones Industrial Average.
————————-
Brian Nelson does not own shares in any of the securities mentioned above. Some of the companies written about in this article may be included in Valuentum’s simulated newsletter portfolios. Contact Valuentum for more information about its editorial policies.