
In recent months, energy producer Linn Energy (click ticker for report: ) has come under fire from the likes of Barron’s and hedge fund managers. The biggest issue for Linn bears, prior to the merger agreement with Berry Petroleum (BRY) was that the company issued unrealistic measures for distributable cash flow per share and for adjusted EBITDA. Both metrics are non-GAAP figures, which can sometimes raise a red flag—especially when a firm’s management team comes under pressure. Let’s take a look at Linn’s metrics and the issues swirling around the stock.
Linn’s Metrics
After the attacks on its metrics, Linn went on the offensive, providing a supplemental presentation elaborating on the company’s non-GAAP metrics.

Source: Linn “Short Seller Response”
The company’s cash flow reconciliation reveals some disturbing news. To calculate distributable cash flow, the company adds back the cost of its put options (originally a reduction in the GAAP calculation of cash from operations). Management claims that the premiums it pays for derivatives are an ‘investment’ (cash from investing) in its business, but we don’t agree. Since its options strategy directly impacts profit and losses on the income statement in any given period, GAAP accounting has it correct (even from an economic standpoint)–there should be a real expense associated with this activity in operating cash flow. During the past few years, these put options have allowed the company to report “realized prices” on natural gas and oil above the spot market rate. However, it appears the company was simply purchasing in-the-money puts.
As Barron’s put it:
“It would be like a money manager buying a put on Microsoft struck at $40, selling the stock at $40 and then ignoring the cost of the option, which would be about $7, based on Microsoft’s recent price of $33.”
In this case, we agree with the skeptics. There are real costs on the GAAP income statement and statement of cash flows that are an accurate economic representation of its underlying business.
Evaluating GAAP-based Cash Flows
That said, let’s now take a look at GAAP-based cash flows…
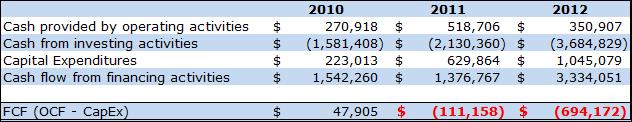
Source: Linn 2012 10-K
As outlined above, free cash flow (OCF less capex) falls well short of distribution needs, and the company has actually been a cash-draining enterprise during the past couple years. As has been one our biggest pet peeves for MLPs (click here for risks of the group), it’s hard to imagine Linn sufficiently covering its payout without the issuance of new capital. Perhaps unsurprisingly, a further look at its statement of cash flows reveals that the company issued $1.97 billion in new units in 2012 and raised new net debt of $2 billion. It has been a cash-starved enterprise.
In fact, operating cash flow (OCF) has been unable to cover distribution payments in two out of the previous three years. In other words, even if the business required no capital expenditures, the company would be unable to continue the magnitude of its payouts based on operations.

Source: Linn 2012 10-K
Underreported Maintenance Capital Expenditures?
Let’s also point out that critics have questioned the legitimacy of the company’s definition of maintenance capital expenditures (as used in the firm’s adjusted EBITDA figure), citing weak organic production growth.

Source: Linn 10-Q; Q1 2013
As shown above, production undoubtedly increased, but both the Hugoton Basin and Green River Basin—two areas that grew significantly—reflected acquisitions from BP (click ticker for report: ) that weren’t included in 2012 results. The increase in Williston/Power River Basin region production came from a joint-venture with Anadarko Petroleum (click ticker for report: ), while East Texas reflects another acquisition made in May of 2012. Subtracting acquisitions, organic production grew just 8% year-over-year. Even worse, production was down marginally compared to the fourth quarter of 2012.
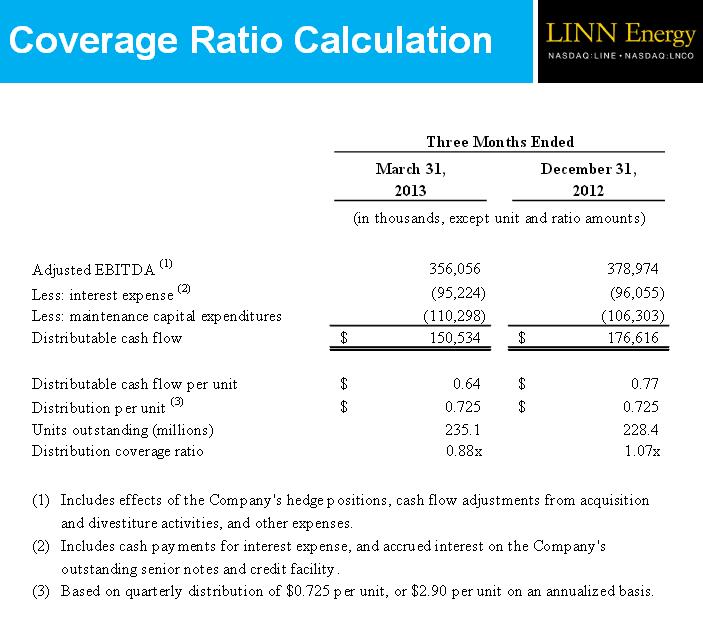
Source: Linn Q1 2013 supplement
Maintenance capital expenditures of only $110 million during the first quarter of 2013 compared to total capital spending of $260 million during the same period may show a) under-reported maintenance capital costs or b) poor capital allocation decisions that are not creating value for shareholders.
Berry Thrown in the Mix
Ultimately, this tells just half of the story. Around the same time doubts started swirling about Linn’s business model, the company entered into an all-stock merger with Berry Petroleum (late February). Since Linn possesses a substantial debt load and high distribution obligations, equity was the only currency the firm had to consummate a deal. This equity came in the form of the LinnCo (LNCO) shares—a recently created holding company that exists for the purpose of owning shares of Linn Energy. The deal ultimately valued Berry at a 20% premium to its previous closing price. However, Linn management noted that the deal would add $0.40 per share in distributable cash flow, and the company will raise its distribution to $3.08 per year—a sizeable 6% increase. In our view, acquiring cash-producing assets that Berry owns is a better strategy than the company’s current one.
Berry’s assets aren’t best-in-class, but they are productive, and the company has posted positive free cash flow in three of the past five years. During the same period, the company has grown oil production over 30%, though natural gas production growth has been modest at best. Insider ownership totals nearly 5% of shares outstanding on a fully-diluted basis. While this isn’t a tremendous amount, it still represents a significant portion of wealth for several of the insiders. Additionally, we assume the descendants of the founders (Bush family) may still collect dividend checks.

Source: Berry Petroleum 2013 10-K/A
With so much wealth invested in the company—particularly for CEO Robert Heinemann—we think the company is incentived to make sure this merger and stock swap is a good deal. The fact that the deal’s timeline was recently extended into the third quarter suggests Berry’s top brass may be doing some more due diligence. We suspect the board could face potential legal action if it was found to be negligent in selling itself to a company worth substantially less than initially thought.
Another important wrinkle in the situation is that the deal is based on market prices.
![]()
Pay particular note to the last line:
“The exchange ratio is fixed and will not be adjusted to reflect changes in the price of Berry common stock or LinnCo common shares prior to the closing of the merger.”
In other words, if shares of LinnCo/Linn continue to fall (assuming Berry shares hold steady), Berry shareholders make less money. With treasury yields rising, risky high-yield securities like Linn Energy look relatively less attractive, which could tarnish the outlook for these high-yield securities. Thus, sentiment might be stacked against the company, and Berry shareholders could kill the deal. Such could end up crushing Linn’s unit prices.
Does Linn look safe?
All things considered, we think the Linn Energy situation highlights why GAAP accounting measures should still be evaluated, even if management assures investors that the non-GAAP numbers are better metrics. Our reading of the cash flow statement suggests that the company’s operating cash flow generation is poor, and as far as we can tell, paying out its distribution relies on healthy-functioning debt and equity markets (which cannot always be guaranteed)*. This might remind Valuentum subscribers of another high-yield sector—mortgage REITs.
Linn’s balance sheet is far from pristine. As of its most recent quarter, the company had a cash balance of $6 million versus long-term debt of $4.8 billion and a credit facility of $1.335 billion. Book value sits at just $17 per share compared to a current stock price in the low $30’s. We don’t see a margin of safety here.
If demand for risky, high-yield energy income units begins to wane, we could see Linn Energy in some major trouble. The other downside risk is that the market one day recognizes Linn’s unprofitable business model, sending shares into a downward spiral. However, acquiring Berry gives Linn several profitable assets, and the “party” could keep on going.
CEO Mark Ellis and founder/director Michael Linn have been net sellers over the past year. Both remain sizeable holders of Linn Energy, but insider selling never looks good when a company is facing public scrutiny.
Regardless, we view Linn Energy as a very high risk situation at this time. We’re not keen on companies that issue additional equity and debt in order to grow distribution payments, but, in our view, the toll collector model employed by the pipelines such as Kinder Morgan (click ticker for report: ) still looks less risky than exploration and production.
We’re staying away from Linn Energy and LinnCo at this time.
* The Valuentum Dividend Cushion for master limited partnerships (MLPs) incorporates the cash proceeds of future equity issuance in the numerator of the calculation. This is unlike traditional operating firms, where capital market activity is excluded. In Linn Energy’s case, its score on the Valuentum Dividend Cushion is 2, but this is largely a function of its capital-markets activity (equity issuance) rather than cash generated from operations. In future iterations of our dividend reports, we plan to disclose both scores for MLPs.