
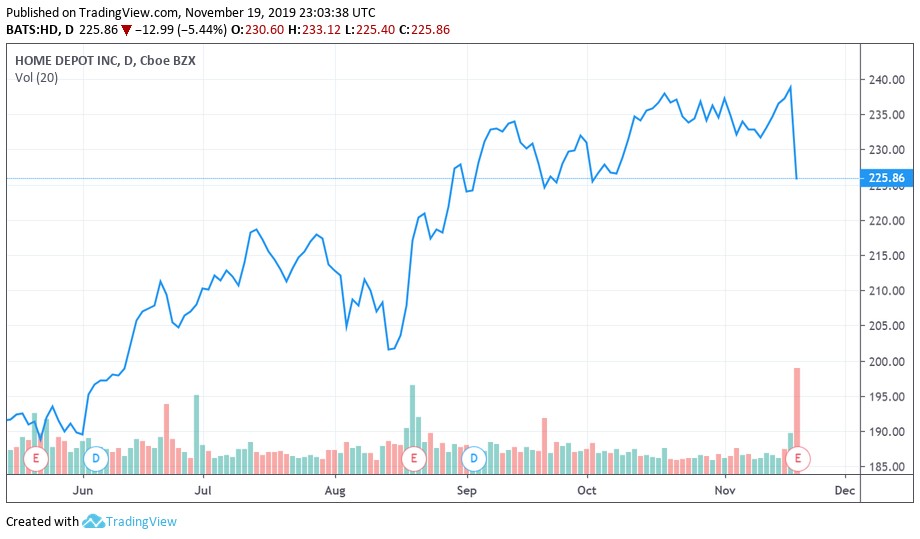
Image Shown: Shares of Home Depot Inc sold off aggressively on November 19 after management reduced the company’s full-year same-store sales and revenue growth guidance for fiscal 2019 during the firm’s third quarter earnings report.
By Callum Turcan
On November 19, Home Depot (HD) reported third-quarter earnings for fiscal 2019 (period November 3, 2019), and same-store sales growth fell way short of expectations, which sent shares of HD sharply lower on the day. Company-wide same-store sales rose by 3.6% year-over-year, supported by 3.8% year-over-year growth in the US last quarter. While decent, the market was pricing shares of HD to outperform which we’ll cover in a moment. Please note Home Depot’s fiscal 2018 was a 53-week period, while its fiscal 2019 is a 52-week period.
The company reported strong growth from both its ‘Pro’ and ‘DIY’ (“do it yourself”) customers last quarter, aided by its digital investments which helped generate meaningful online growth in terms of sales ordered online, ticket size, and online traffic. Management noted that about half of Home Depot’s online orders in the US were facilitated by the customer picking up the items in-store. Additionally, online growth was widespread across Home Depot’s departments according to management.
Stretched Valuation
Home Depot lowered its guidance for fiscal 2019 during the firm’s third quarter earnings report, and management now sees the company’s same-store sales growing by 3.5% annually company-wide, down from the 4.0% growth rate that was previously expected. Given the run seen in shares of HD over the past year, this recent pull back wasn’t surprising. Shares of HD yield 2.4% as of this writing.
At the top end of our fair value estimate range, we value HD at $210 per share, far below where HD is trading at as of this writing (~$226 per share). That indicates the market has likely gotten way ahead of itself at the moment, especially now that Home Depot itself is scaling back its near-term growth expectations.
In the graphic down below, from our 16-page Stock Report covering Home Depot (can be accessed here), we highlight our base case assumptions used to derive our fair value estimate of $175 per share of HD. To achieve an intrinsic value estimate near the top of end of our fair value estimate range, one would have to assume free cash flow growth rates well in excess of what’s laid out below. We don’t think such growth rates are feasible given the nature of Home Depot’s cyclical business.
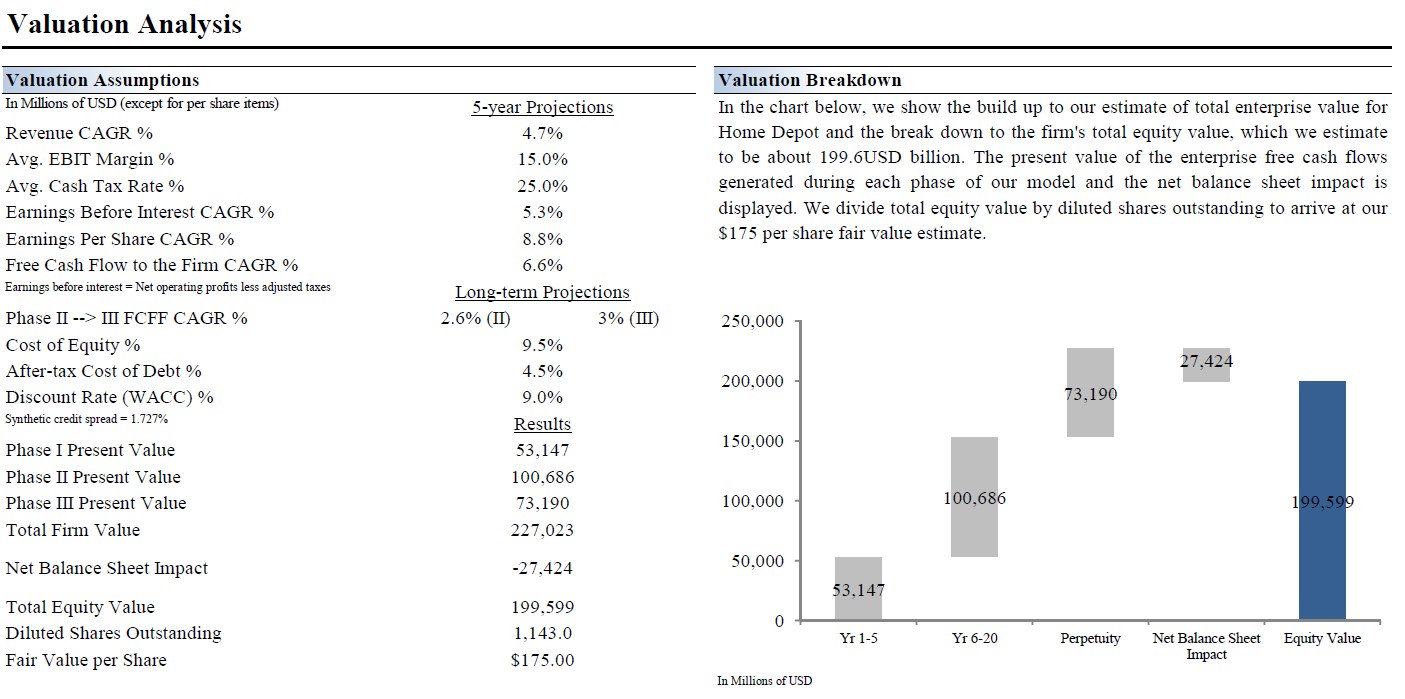
Image Shown: Home Depot has a great free cash flow profile however, shares of HD are trading at a lofty valuation as of this writing that in our view is tough to justify, especially when keeping exogenous headwinds in mind.
Quarterly Overview
In the third quarter, Home Depot’s GAAP gross margin slipped by just over 30 basis points year-over-year while its GAAP revenues climbed higher by 3.5%. This could indicate that it’s becoming harder for Home Depot to push through price increases without hurting its sales performance, keeping the negative impact of tariffs and the US-China trade war in mind. Here’s a key excerpt from Home Depot’s executive VP of merchandising, Ted Decker, during the firm’s latest quarterly earnings call (emphasis added):
“Let me take a moment to comment on tariffs. As expected, during the third quarter we saw increased cost rising from tariffs. Our merchants, finance and data analytics teams are doing an incredible job mitigating cost impacts and helping us evaluate our elasticities. While still early days, we continued to believe we can effectively manage tariffs. However, we remain cautious on how tariffs could impact the consumer more broadly. Going forward, we will use our tools and analytics to help us continue to focus on being the customer’s advocate for value.”
Management also noted that Home Depot now expects to report year-over-year revenue growth of 1.8% in fiscal 2019, down from 2.3% previously. However, Home Depot didn’t lower its year-over-year diluted EPS growth forecast of 3.1% in fiscal 2019 as the company apparently plans to mitigate its slower sales growth trajectory with savings elsewhere. That may be a tough task given its GAAP operating margin dropped by just over 20 basis points year-over-year last quarter (due to its shrinking gross margins), but please keep in mind the company has been aggressively buying back its stock.
Share Buybacks and Dividend Coverage
During the first nine months of Home Depot’s fiscal 2019, the firm spent $3.9 billion repurchasing its stock. That help reduced Home Depot’s outstanding diluted share count by over 4% year-over-year in the third quarter. Home Depot generated $10.7 billion in net operating cash flow during the first nine months of fiscal 2019 versus $1.9 billion in capital expenditures, allowing for $8.8 billion in free cash flow. Those free cash flows fully covered $3.9 billion in share buybacks and $4.5 billion in cash dividends during this period.
Home Depot exited the third quarter (ended November 3) with a net debt load (inclusive of short-term maturities) of $26.9 billion, as its $2.2 billion in cash and cash equivalents only modestly offset its large total debt load. We like the growth trajectory of Home Depot’s dividend payout and give the firm an EXCELLENT Dividend Growth rating, but its large debt load weighs negatively on its dividend coverage. Home Depot’s Dividend Cushion ratio stands at 1.2x. As the company’s free cash flow profile is quite strong, we still rate Home Depot’s Dividend Safety rating as GOOD, but caution that competing uses of capital (share buybacks, debt maturities) need to be kept in mind.
Concluding Thoughts
We think Home Depot’s shares are way ahead of themselves given rising exogenous headwinds and the looming threat of additional tariffs should ongoing US-China trade talks break down. The company has a great cash flow profile, but its valuation is stretched as the growth rates required to justify its current valuation aren’t realistic in our view. We like the holdings in our Dividend Growth Newsletter portfolio instead, which can be viewed here—->>>>
Specialty Retailers Industry – AAN BBBY BBY GME HD LOW LL ODP SHW TSCO WSM
Building Materials Industry – CSL LPX MLM MAS MHK OSB OC VMC
—-
Valuentum members have access to our 16-page stock reports, Valuentum Buying Index ratings, Dividend Cushion ratios, fair value estimates and ranges, dividend reports and more. Not a member? Subscribe today. The first 14 days are free.
Callum Turcan does not own shares in any of the securities mentioned above. Some of the companies written about in this article may be included in Valuentum’s simulated newsletter portfolios. Contact Valuentum for more information about its editorial policies.