
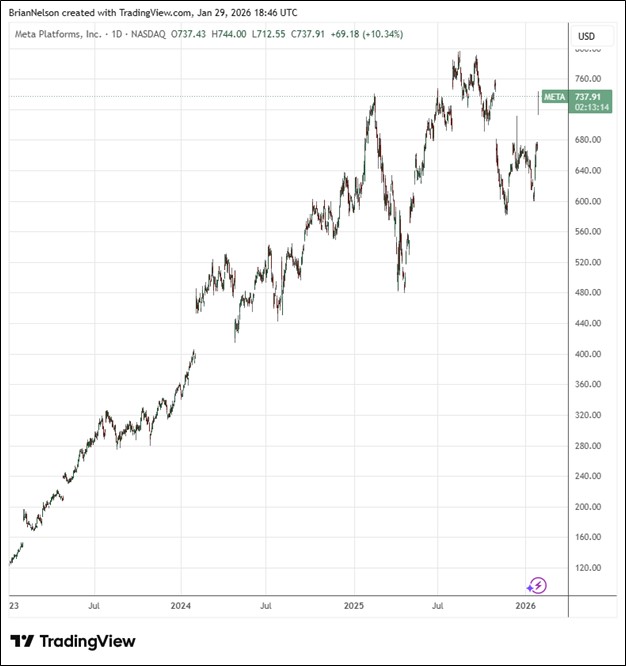
Image Source: TradingView
By Brian Nelson, CFA
On January 28, Meta Platforms (META) reported fourth quarter results that showed a beat on both the top and bottom lines. Revenue increased 24% year-over-year in the quarter (up 23% on a constant currency basis), to $59.9 billion, beating consensus expectations for growth of about 21%, while income from operations advanced 6% year-over-year. Its operating margin contracted roughly 7 percentage points in the period, though net income and diluted earnings per share increased 9% and 11%, respectively. Diluted earnings per share was $8.88, up from $8.02 in the year ago period.
Family daily active people (DAP) was 3.58 billion on average for December 2025, an increase of 7% year-over-year. Ad impressions increased 18% in the fourth quarter, while average price per ad increased 6% year-over-year. Capital expenditures were $22.14 billion and $72.22 billion for the fourth quarter and full year 2025, respectively. Cash and cash equivalents were $81.59 billion at the end of the quarter versus long-term debt of $58.74 billion. Free cash flow was $14.08 billion and $43.59 billion for the fourth quarter and full year 2025, respectively.
Looking to the first quarter of 2026, Meta Platforms expects total revenue to be in the range of $53.5-$56.5 billion, beating expectations calling for $51.4 billion and reflecting in part a 4% tailwind from foreign currency. Management expects full year 2026 total expenses to be in the range of $162-$169 billion, with the majority of the expense growth driven by infrastructure costs and the second largest contributor being employee compensation driven by investments in technical talent.
2026 capital expenditures are expected to be in the range of $115-$135 billion. For comparison, Meta Platforms generated $115.8 billion in operating cash flow in 2025. Despite the meaningful expected rise in full year total expenses, in 2026, management expects to deliver operating income that is above 2025 operating income. We continue to monitor Meta Platforms’ return on investment, but our $781 fair value estimate remains unchanged at this time.
—–
Brian Nelson owns shares in SPY, SCHG, QQQ, QQQM, DIA, VOT, RSP, and IWM. Valuentum owns SPY, SCHG, QQQ, QQQM, VOO, and DIA. Brian Nelson’s household owns shares in HON, DIS, HAS, NKE, DIA, RSP, SCHG, QQQ, QQQM, and VOO. Some of the other securities written about in this article may be included in Valuentum’s simulated newsletter portfolios. Contact Valuentum for more information about its editorial policies.
Valuentum members have access to our 16-page stock reports, Valuentum Buying Index ratings, Dividend Cushion ratios, fair value estimates and ranges, dividend reports and more. Not a member? Subscribe today. The first 14 days are free.