
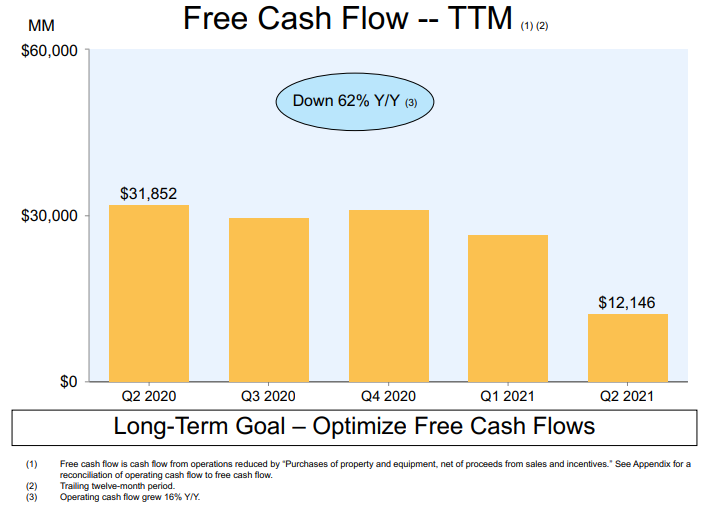
Image: Amazon’s free cash flow performance was hugely disappointing during its second quarter of 2021.
By Brian Nelson, CFA
We were disappointed in Amazon’s (AMZN) mixed second-quarter report released after the bell July 29. The e-commerce and web services giant missed revenue expectations, while the company’s bottom-line earnings-per-share number of $15.12 came in better than the consensus figure. We find it highly ironical that Amazon’s shares are selling off on a hugely profitable quarter when years ago the Street was complaining about it bleeding red ink. Shares of Amazon are trading down to about our fair value estimate of ~$3,343 at the time of this writing; the sell-off may be deserved.

Image shown: Amazon’s fair value distribution from its 16-page stock report. Our discounted cash flow process values each firm on the basis of the present value of all future free cash flows. Although we estimate Amazon’s fair value at about $3,343 per share, every company has a range of probable fair values that’s created by the uncertainty of key valuation drivers (like future revenue or earnings, for example). After all, if the future were known with certainty, we wouldn’t see much volatility in the markets as stocks would trade precisely at their known fair values. Our ValueRisk rating sets the margin of safety or the fair value range we assign to each stock. In the graph above, we show this probable range of fair values for Amazon.com. We think the firm is attractive below $2,507 per share (the green line), but quite expensive above $4,179 per share (the red line). The prices that fall along the yellow line, which includes our fair value estimate, represent a reasonable valuation for the firm, in our opinion.
In addition to the sales miss, there was one big thing wrong with the Amazon report. The second quarter clearly represented a hiccup in free cash flow performance. For the trailing twelve months ended June 30, operating cash flow jumped 16% to $59.3 billion, but sequentially the measure fell, when last year it increased materially from the first to the second quarter. This represents a change in trend. During the most recent trailing twelve-month period, management also spent $47.2 billion in property, plant and equipment (capital expenditures), which was up 144% on a year-over-year basis, resulting in a 62% decline in free cash flow, to $12.1 billion, over the same twelve-month period last year. We didn’t like the free cash flow performance at all. Amazon’s net cash balance also fell to $39.6 billion from $52.6 billion at the end of last year.
Though the sell-off in Amazon’s shares during the trading session July 30 is understandable, the company’s pace of sales growth continues to be very healthy and is expected to advance in the current third quarter between 10%-16% compared with the same period in 2020. Operating income guidance for the current third quarter of $2.5-$6 billion may be considered a bit light, but the wide range is all too commonplace for Amazon, too. Amazon is a notoriously difficult company to value, as even minor changes in its mid-cycle operating margin assumption can have large implications, either good or bad, on its fair value estimate. As such, we would expect Amazon’s stock to be highly volatile as investors continue to iterate which set of future expectations may be best to drive the share price on the open market.
We’re not interested in Amazon’s shares at this time. Facebook (FB) remains our favorite idea for capital appreciation, and our recently-raised fair value estimate of the social media giant makes it one of the most undervalued companies on the market today. We like Microsoft (MSFT) the most when it comes to dividend growth potential, though the software and cloud services provider’s dividend yield isn’t as high as we would like. Though Amazon has spoiled the party a bit with its lackluster second-quarter report, we still are big fans of big cap tech and large cap growth and believe the area remains the best place to be for long-term capital appreciation potential.
—–

—–

Image Source: Value Trap
———-
Valuentum members have access to our 16-page stock reports, Valuentum Buying Index ratings, Dividend Cushion ratios, fair value estimates and ranges, dividend reports and more. Not a member? Subscribe today. The first 14 days are free.
Brian Nelson owns shares in SPY, SCHG, QQQ, DIA, VOT, and IWM. Brian Nelson’s household owns shares in HON, DIS, HAS. Valuentum owns shares in VOO, SCHG, DIA, and QQQ. Some of the other securities written about in this article may be included in Valuentum’s simulated newsletter portfolios. Contact Valuentum for more information about its editorial policies.