

Image Source: Eric
By Callum Turcan and Brian Nelson, CFA
Let’s answer some questions we received recently from our members. Please note that the wording of some of the questions was modified somewhat for clarity.
Question: What do you think about Moderna (MRNA), as their mRNA technology can be used for far more than just Covid-19 vaccines?
Answer: We are simply amazed at how fast the pharmaceutical industry, in conjunction with various partners and government programs (Operation Warp Speed and others), discovered a safe and viable vaccine for the coronavirus (‘COVID-19’). Moderna was key to making that possible after its COVID-19 vaccine received emergency approval from the US FDA in December 2020. With a vaccine efficacy of 94.1%, Moderna really was able to showcase the power of mRNA technology.
Looking ahead, Moderna’s vaccine pipeline (built upon its expertise in the realm of mRNA) is quite robust as you can see in the upcoming graphic down below, and we are particularly interested in its oncology and seasonal flu vaccine candidates (given the commercial potential in this area, and there is a very real societal need for improvements in battling the scourge that is cancer). Moderna’s outlook is fantastic, though with only one commercialized vaccine offering (for COVID-19), its fair value estimate range is rather wide.

Image Shown: Moderna’s vaccine pipeline is robust and covers a lot of ground, underpinned by its cutting-edge mRNA technology. Image Source: Moderna – May 2021 IR Presentation
Question: First of all, thank you for the excellent work- it is a pleasure to follow your team’s ideas and how they work out! I read increasingly about the proposed changes in global corporate taxation and the implications this will have on big tech e.g., Alphabet (GOOG) (GOOGL), Microsoft (MSFT), Apple (AAPL), Facebook (FB). It will be probably interesting for your subscriber base to know your thoughts on that considering the weighting of these names in the sample portfolios.
Answer: Thank you for the warm thoughts, we appreciate it!
As it concerns the estimated cash tax rate for companies, through the enterprise cash flow analysis process we can stress test our models by adjusting the estimated corporate income tax rate to gauge the changes in fair value. Looking at the proposed minimum global corporate tax rate that has the backing of ~130 countries, at 15% that is unlikely to have a seriously deleterious effect on the major tech giant’s future forecasted free cash flows (it will impact their fair value estimates in a marginal to modest way).
Pivoting to the potential changes in the US corporate income tax rate, in our view, our base case is that there is a decent chance it gets raised up to 25% (up from 21% currently) rather than President Biden’s 28% proposal (not a guaranteed thing) given the opposition to a larger tax increase from some key Democratic senators. In any event, we are waiting for greater details on these situations and will update our cash flow models accordingly (with an eye towards the estimated future corporate cash income tax rate), but we continue to be huge fans of firms with net cash positions and strong free cash flow generating abilities whose outlooks are supported by secular growth tailwinds.
Large cap tech and payment processing firms, like PayPal (PYPL) and Visa (V), fit the bill.
Question: Regarding PPL Corp (PPL), is your VBI rating of 9 correct?
Answer: The utility PPL is quite an interesting firm given its transformative deal with National Grid plc (NGG) which we covered in our Utility PPL Is Pursuing a Major Transformation and Has a VBI Rating of 9 article (link here). In our view, investors are looking for greater clarity on what PPL intends to do with its large net cash infusion (the sale of its UK operations has been completed and now PPL is a pure play US utility) once its deal to acquire Rhode Island’s leading utility is complete (which is forecasted to occur by March 2022).
Debt reduction efforts are already underway, and the acquisition is going through the regulatory process, but investors likely want to know whether share buybacks, dividends and/or capital expenditures are going to be prioritized going forward (in other words, what are PPL’s core capital allocation priorities post-transformation). We are keeping an eye on the situation, and expect that during its upcoming earnings, PPL will provide some additional color here.
Note that we do not add all stocks that register high ratings on the Valuentum Buying Index (VBI) to the newsletter portfolios. Please see the last question in this Q&A roundup for further detail.
Question: Is there any news regarding the sale of Korn Ferry (KFY) top officers selling some of their stock?
Answer: While we always want to see executives have as much “skin in the game” as feasibly possible, insider stock buying and selling activity has only a modest impact on our outlook towards companies. The enterprise cash flow analysis model is built around the company’s future forecasted financial performance, and unless insider stock buying and selling activity indicates there may be trouble afoot (such as an accounting scandal, for example), executives cashing in some of their stock does not change our fair value estimate or view towards a firm. There is a long list of reasons why an executive would want to sell their stock. With shares of Korn Ferry trading near their all-time highs, some selling activity is to be expected from time to time. We continue to be big fans of Korn Ferry and like the firm as an idea in the Best Ideas Newsletter portfolio.
Question: What is a fair value estimate?
Answer: The fair value estimate is our best estimate of the true intrinsic value of the stock and rests as the highest point on the probability distribution of the fair value estimate range (as shown below), which itself represents a broader fair value estimate of the equity. The fair value estimate is derived by a three-stage discounted cash flow model (enterprise valuation), while the fair value range uses the fair value estimate as a midpoint to ascribe what we think would be a fair market price for the stock to trade within.
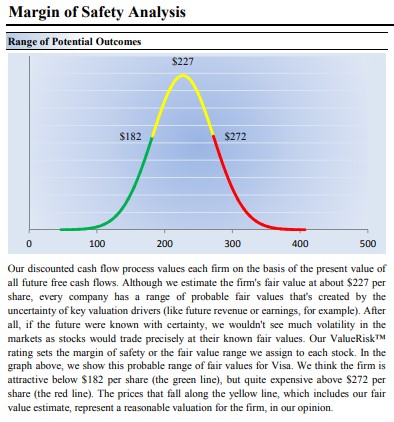
Image Shown: Visa’s fair value estimate range. Image Source: Valuentum’s 16-page stock report of Visa.
Let’s use Visa (V) as an example. Based on our discounted cash-flow process, we value shares of Visa at $227 per share. The stock trades at ~$248 per share at the time of this writing, so its price-to-fair value (P/FV) estimate stands at ~1.05. The low end of our fair value estimate range is $182 per share, while the high end of our fair value estimate range is $272. In other words, we could see shares of Visa rise to as much as $272 per share before we would grow concerned about its underlying valuation.
If Visa’s shares dropped below $182 per share and carved out a nice bottom/base (meaning that the market was supporting the equity on a technical basis through strong relative strength and/or share-price momentum), it would register one of the highest ratings on the Valuentum Buying Index, and we would view it as one of the most attractively positioned stocks on the market, along with Facebook – which had been (and continues to be) severely underpriced while showing continued strong share-price momentum; hence, Facebook’s high rating on the Valuentum Buying Index.
Importantly, the fair value estimate, the price-to-fair value (P/FV) ratio, the fair value estimate range, and the Valuentum Buying Index are only a handful of metrics on our website to use to evaluate new ideas. The simulated newsletter portfolios help surface our favorite ideas in the construction of diversified equity portfolios, as in the case of the Best Ideas Newsletter portfolio and Dividend Growth Newsletter portfolio (the High Yield Dividend Newsletter portfolio offers even more diversified exposure). When adding or removing companies from the newsletter portfolios, we also consider market conditions and diversification parameters, so it’s critical to reiterate that no metric should ever be used by itself.
Question: When I look at the company vitals information on the left side of the first part of each stock page, are the ‘Est. Normal Diluted EPS’ and ‘P/E on Est. Normal Diluted EPS’ essentially the same as 12-month forward EPS and 12-month forward P/E I see from other data sources (just worded differently and based on your estimates rather than “consensus figures”)? It seems like this would be the case, but I wanted to double check. Do you all back out the company’s net cash position when looking at this metric?
Answer: Our normalized P/E ratios and EV/EBITDA ratios consider the companies’ current price relative to the average earnings or average EBITDA over a reasonable forward-looking cycle, generally five years. For example, the ‘Est. Normal Diluted EPS’ will take the price at the time of the report and divide that by the average annual EPS over the next five years. The same process occurs with respect to the current price of EV (market cap plus book value of debt, preferred) divided by the average of annual EBITDA over the next five years.
The normalized measures are unique as they take into consideration our forecasts over the next five years within the context of our enterprise discounted cash flow process. The net cash position is not backed out of the ‘Est. Normal Diluted EPS.’ The net cash position is considered in our fair value estimate, namely the price-to-fair value (P/FV) ratio as well as in the context of enterprise value (EV), applied within the EV/EBITDA multiple, for example.
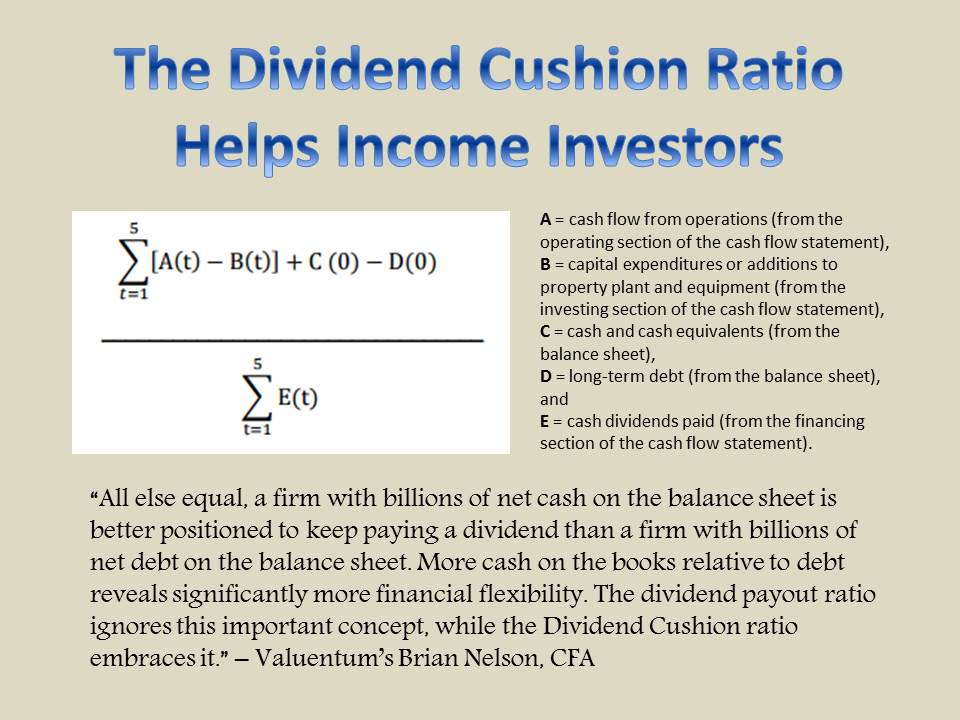
Question: Please explain the difference between the raw, unadjusted Dividend Cushion ratio and the adjusted Dividend Cushion ratio, and what is considered a good score for the unadjusted Dividend Cushion ratio, what is an excellent score, what is neutral and what is poor? Also, how much relative importance should I give to each score?
Answer: The raw, unadjusted Dividend Cushion ratio adds a firm’s net cash position to the sum of its future free cash flows (cash flow from operations less all capital spending) over the next five years and takes that sum and divides it by the sum of the company’s expected cash dividends paid and growth in them over the next five years. The Dividend Cushion ratio is essentially a coverage ratio — the higher the ratio above 1, the better able the company will be able to cover dividend payments in the future, in our view. For most of our coverage and for most corporates, the qualitative ratings for safety and growth are a function of the raw, unadjusted Dividend Cushion ratio, as shown below.
For MLPs, REITs, and some utilities, however, we make modifications to the raw, unadjusted Dividend Cushion ratio in deriving the adjusted Dividend Cushion ratio. For example, with MLPs, we add back future equity issuance to the numerator and mitigate the company’s debt load to a degree on account of assuming ongoing refinancing capacity for such entities. These adjustments result in a sharp upward revision to the raw, unadjusted Dividend Cushion ratio. For MLPs, REITs, and some utilities, we base the qualitative rating on this enhanced adjusted Dividend Cushion ratio, but we also disclose the raw, unadjusted Dividend Cushion ratio in each case.
In short, we believe both the raw, unadjusted Dividend Cushion ratio and the adjusted Dividend Cushion ratio offer insights. The former reveals the capital-market-dependency risks inherent to MLPs, for example, while the latter acknowledges that under benign market conditions, continued funding of the distribution/dividend would ensue. We place greater emphasis on the raw, unadjusted Dividend Cushion ratio because it is more of a pure risk measure than the adjusted one, which considers a variety of incremental funding sources, which cannot be guaranteed during difficult credit conditions.
Categories Member Articles