
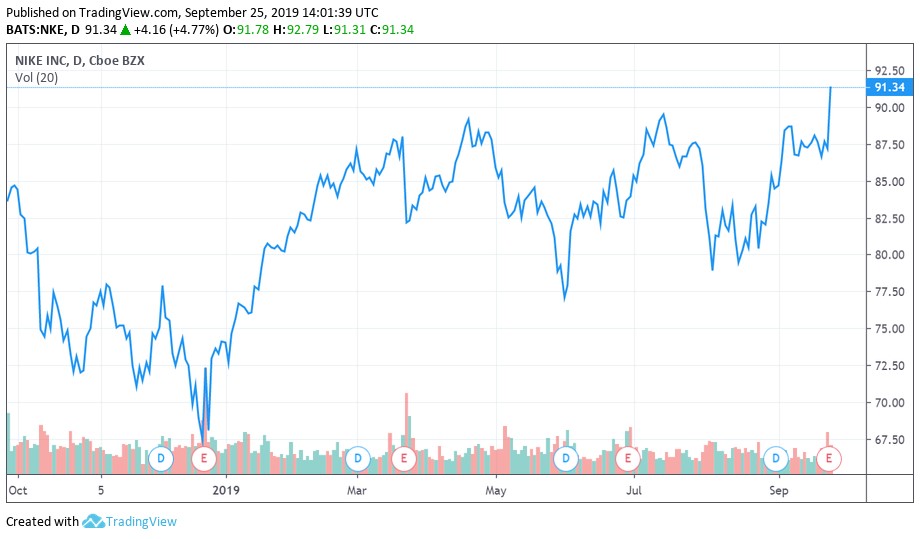
Image Shown: Shares of Nike popped on September 25 after reporting a strong first quarter for fiscal 2020 and issuing favorable guidance for the full fiscal year.
By Callum Turcan
Nike (NKE) reported earnings for the first quarter of its fiscal 2020 (ended August 31) on September 24 and investors clearly liked what they saw. The sportswear company’s GAAP revenues climbed 7% year-over-year to $10.7 billion, a growth rate that would have been 10% on a constant currency basis given ongoing strength in the US dollar. Sales in the Greater China region rose by 27% year-over-year on a constant-currency basis, complemented by strong growth in EMEA (up 12% on a constant currency basis) and the Asian Pacific region (up 13% on a constant currency basis). Revenues in North America were up a decent 4% year-over-year (as reported and on a constant currency basis). Footwear, apparel, and equipment sales across regions all performed well relatively speaking. Shares of NKE yield ~1.0% as of this writing.
Quarterly Review
The company’s GAAP gross margin climbed 150 basis points year-over-year and hit 45.7% in the first quarter, a sign Nike’s direct-to-consumer distribution channel strategy is working. Nike Direct is helping Nike boost its average selling prices by getting rid of middlemen (as an aside, Nike continues to have a close business relationship with several key sportswear retailers) and this is part of the Direct Consumer Offence strategy the company launched in calendar year 2017.
While the Nike Direct strategy is putting upward pressure on certain operating expenses, that’s more than offset by the positive gross margin improvements. GAAP operating expenses rose to 31.2% of revenues in the first quarter, up 40 basis points from the same period a year-ago, due to rising operating overhead expense and to a lesser extend rising demand creation expense (namely marketing and advertising spending). Due to gross margin improvements, Nike’s GAAP operating margin still climbed higher by almost 110 basis points in the first quarter on a year-over-year basis, hitting ~14.5%.
In the graphic below, note that Nike’s gross margins have been on an upward trend of late which we appreciate. Higher selling prices and Nike Direct have been key, highlighting the quality brand power Nike has at its disposal (from Nike to Converse to Air Jordan and more).
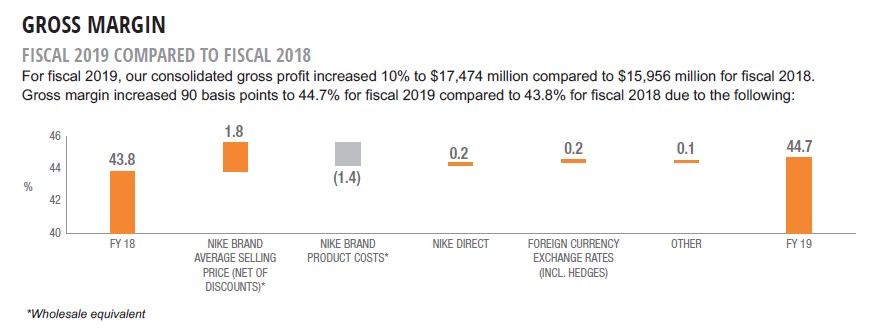
Image Shown: Nike’s gross margins expanded in fiscal 2019 versus fiscal 2018 levels, a trend that continued into the first quarter of fiscal 2020. Image Source: Nike – Fiscal 2019 Annual Report
All of this culminated into Nike’s GAAP diluted EPS climbing to $0.86 in the first quarter of fiscal 2020, up from $0.67 in the same period a year-ago. Share buybacks were also at play, shaving over 2% off its diluted outstanding share count during this period. On June 2018, Nike approved a four-year $15.0 billion buyback program. By the end of August 2019, approximately $2.0 billion of that program had been utilized. Nike ended August 31 with a net debt load of $0.1 billion, with $3.6 billion in cash, cash equivalents, and short-term investments almost outstripping total debt of $3.7 billion.
Nike’s net cash position in the first quarter of fiscal 2019 flipped to a net debt position due to the company utilizing its cash position to repurchase shares. We value shares of NKE at $88 per share at the top end of our fair value estimate range, and we give the firm an Excellent Dividend Cushion ratio of 3.7x on the basis of its strong expected free cash flows and limited total debt burden. Nike’s dividend growth trajectory looks bright, but shares are richly valued as of this writing.
Free cash flows at Nike have averaged $3.8 billion per year from fiscal 2017 to fiscal 2019, hitting $4.8 billion in fiscal 2019 on the back of strong net operating cash flow growth (which rose from $3.8 billion in fiscal 2017 to $5.9 billion in fiscal 2019). The firm’s annual dividend commitments averaged $1.2 billion from fiscal 2017 to fiscal 2019, hitting $1.3 billion in fiscal 2019 as Nike continues to ramp up its per share payout (growing from a quarterly payout of $0.18 per share at the start of calendar year 2017 to $0.22 per share as of August 2019).
We think there’s room for significant dividend payout increases ahead, which will depend in part of the size of Nike’s share buybacks going forward. Repurchases consumed $3.9 billion per year on average from fiscal 2017 to fiscal 2019, hitting $4.3 billion in fiscal 2019. Buybacks need to be managed alongside dividend increases, but there’s room to pursue both.
Guidance Update
Management issued out favorable guidance for fiscal 2020 during Nike’s latest quarterly conference call (emphasis added):
“For the full year we continue to expect reported revenue growth within the high single-digit range, slightly exceeding fiscal year ’19 reported revenue growth. This incorporates our improved currency neutral outlook being largely offset by the more intense FX headwinds of late associated with trade dynamics.
Recall that the impact of foreign exchange hedges is not accounted for within our revenue line item. We now expect to deliver full year gross margin expansion within the 50 to 75 basis point range. That assumes that the negative impact of recently implemented tariffs remains in effect for the balance of our fiscal year.”
Guidance calling for gross margin expansion and top line growth further highlights strong underlying demand for Nike products.
Concluding Thoughts
Nike has been performing quite well given foreign currency headwinds and the ongoing US-China trade war, and it’s clear that hasn’t undermined core demand for its popular sportswear and equipment products. We are still staying on the sidelines given how shares of NKE are richly valued, in our view.
Luxury Goods (Established Brands Industry) – EL LULU NKE PVH REV SIG UA VFC
Related: FXI, MCHI
—-
Valuentum members have access to our 16-page stock reports, Valuentum Buying Index ratings, Dividend Cushion ratios, fair value estimates and ranges, dividend reports and more. Not a member? Subscribe today. The first 14 days are free.
Callum Turcan does not own shares in any of the securities mentioned above. Some of the companies written about in this article may be included in Valuentum’s simulated newsletter portfolios. Contact Valuentum for more information about its editorial policies.