

Image Source: Marathon Oil Corporation — Fourth-quarter IR presentation.
Global oil prices are climbing back up again and that got us thinking about three of the biggest independent upstream players in America’s shale patch.
By Callum Turcan
Global oil prices are rising and that has gotten us thinking about upstream players EOG Resources Inc (EOG), Noble Energy Inc (NBL), and Marathon Oil Corporation (MRO). All three of these companies possess domestic and international producing operations, with unconventional upstream opportunities in America providing a key growth generator as market conditions allow. Stronger realizations will lead to improving financial performance on a sequential basis, but ultimately, valuations are based on price expectations over decades not quarters. This generally makes valuing upstream firms on P/E ratio basis an erroneous decision as the historical performance isn’t indicative of future potential, as that is largely a function of capricious oil markets. For that reason, we prefer our discounted cash flow analysis instead.
EOG Resources
Sometimes referred to as the Amazon Inc (AMZN) of the shale world, EOG Resources is active in several of the top plays in America. With operations in the Permian Basin, the Eagle Ford, and elsewhere, EOG Resources is well positioned to capitalized on any domestic liquids upside to be had through hydraulic fracturing and horizontal drilling (colloquially known as fracking). EOG Resources also has a sizable presence in Trinidad & Tobago and a minor footprint in China, where the firm is targeting resources that are heavily-weighted towards natural gas.
As of this writing, EOG Resources is trading right at the middle of its range of expected fair values and yields just 0.9%, as most of the company’s net operating cash flow is directed towards capital expenditures. Shale is often described as a treadmill, where rising production can only be maintained through ever increasing capital expenditure budgets (to fund increased drilling and most importantly completion activity). The second you stop drilling and fracking those wells, company-wide production levels move precipitously lower due to sharp annual decline rates (50%-80% depending on what play the well is developing, the geology of the formation being targeted, the water cut of that particular well’s production, and other things like oil well choke management).
Here is an example of this treadmill in action. When oil prices were subdued in 2016, EOG Resources spent $2.6 billion on capital expenditures (combining ‘Additions to Oil and Gas Properties’ and ‘Additions to Other Property, Plant and Equipment’) while generating just $2.4 billion in net operating cash flow. A year later when prices were significantly higher, EOG Resources generated $4.3 billion in net operating cash flow but spent $4.1 billion on capital expenditures, leaving little room for free cash flow. The company had to invest more in the business otherwise its production base would have dropped off a cliff.
Come 2018, when oil prices were (relatively speaking) quite dear, EOG Resources generated $7.8 billion in net operating cash flow versus $6.1 billion in capital expenditures. That’s when management could finally point towards the shale business model as being economically viable. From 2016 to 2018, EOG Resources’ total dividend payments were roughly $0.4 billion each year, meaning those payouts were fully covered for the first time in a while last year. EOG Resources plans to continue increasing its capital expenditures this year, bringing targeted spending up to $6.1-6.5 billion. Most of EOG Resources’ expected 2019 investments are slated to go towards its Eagle Ford, Delaware Basin (within the Permian Basin), and ‘Rocky Mountain area’ (Powder River Basin and DJ Basin) divisions, which at the midpoint of guidance would generate 14% annual oil production growth from its domestic operations.
EOG Resources’ management team is very shareholder friendly and has tried to reward shareholders the best they could, namely through dividend increases and by attempting to live within internal cash flow generation. In 2017 and 2018 combined, the company spent almost $1.0 billion retiring debt, which we are very supportive of but note EOG Resources still sported a $4.5 billion net debt position at the end of last year. While EOG Resources is considered one of the best in the business, the firm is always at the mercy of the shale treadmill. The company’s Dividend Cushion ratio of 2.3 indicates its modest yield is likely safe going forward, but any prolonged downturn in oil prices will put tremendous pressure on EOG Resources’ financials.

Image Shown: EOG Resources has posted strong dividend growth over the years, albeit off of a very low base, and plans to continue retiring debt going forward. Image Source: EOG Resources – Fourth quarter 2018 IR presentation
Noble Energy
One key thing that makes Noble Energy stand out from its peers is its huge presence in Israel’s offshore upstream industry, with an eye on the massive Tamar and Leviathan natural gas fields in the Mediterranean Sea. Gross natural gas production from the producing Tamar field is close to 1 billion cubic feet per day, and when the Leviathan field comes online at the end of this year or beginning of next year, that should continue marching higher. Beyond its offshore Israeli position, Noble Energy operates in the DJ Basin, the Permian Basin, the Eagle Ford, and has a material presence in Equatorial Guinea’s hydrocarbon industry.
As of this writing, the company is trading modestly below the midpoint of our range of potential fair value outcomes and yields 1.8%. Keep in mind that yield isn’t well protected and that Noble Energy sports a -2.9 (negative 2.9) Dividend Cushion Ratio. In the event of a prolonged downturn in global raw energy resource prices, namely oil, Noble Energy’s quarterly dividend may prove not to be resilient. In the past, management was forced to cut Noble Energy’s payout (which occurred in early-2016) in order to pare down spending levels.
Like EOG Resources, Noble Energy has had to contend with the shale treadmill, a situation made harder due to its big international investments (particularly, those in Israel). In 2016, the company generated $1.4 billion in net operating cash flow versus $1.5 billion in capital expenditures. By 2017, Noble Energy’s net operating cash flow had perked up to $2.0 billion, but $2.6 billion in capital expenditures made positive free cash flow unobtainable. Last year, Noble Energy posted $2.3 billion in net operating cash flow, which fell way short of $3.3 billion in capital expenditures. The company spent roughly $0.2 billion on its annual dividend payments over this period, which clearly wasn’t covered by free cash flow.
Noble Energy plans on spending $2.4-$2.6 billion on capital expenditures this year, which is projected to fall down to $2.0-$2.2 billion in 2020. While that will free up capital for other uses at a time when, in theory, Noble Energy’s net production should be climbing (management expects 5% company-wide production growth this year), keep in mind that any prolonged downturn in raw energy resource prices would have a severely negative impact on its financials. At the end of 2018, Noble Energy had a consolidated net debt position of $5.9 billion, keeping in mind the firm has a large economic stake in its midstream MLP spin-off Noble Midstream Partners LP (NBLX).
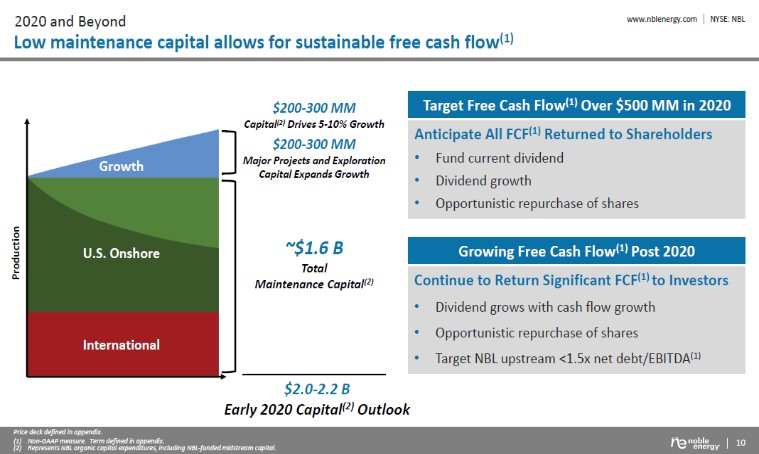
Image Shown: Noble Energy is targeting positive free cash flow generation in 2020. Image Source: Noble Energy – Fourth quarter 2018 IR presentation.
Marathon Oil
The last upstream firm we are going to look at in this note is Marathon Oil, which used to be a part of a larger integrated oil company before the upstream and downstream businesses were split back in 2011. Marathon Petroleum Corporation (MPC), the downstream player, has vastly outperformed Marathon Oil since then. As of this writing, Marathon Oil trades near our midpoint of its range of expected fair value outcomes and yields 1.2%.
Marathon Oil operates in many of the same unconventional plays as EOG Resources and Noble Energy including; the Bakken, the STACK/SCOOP in the Anadarko Basin, the Eagle Ford, the Permian Basin, and even the emerging Louisiana Austin Chalk play (where EOG is also active). Internationally, Marathon Oil has a significant presence in Equatorial Guinea, just like Noble Energy. Another similarity between Marathon Oil and Noble Energy is that Marathon Oil cut its dividend in late-2015 to reduce its cash flow outlays during the nadir of the prolonged crude oil pricing downturn since late-2014.
In 2016, Marathon Oil generated $0.9 billion in net operating cash flow versus $1.2 billion in capital expenditures. As you can see, there is a common theme here and that is 2016 was a terrible time to be an upstream producer with a liquids-rich production base. However, Marathon Oil was fortunate to close the gap in 2017, with $2.0 billion in net operating cash flow covering $2.0 billion in capital expenditures. The company’s $0.2 billion in annual dividend payments were covered with cash on hand, a product of divestment proceeds. Marathon Oil’s total dividend payouts stood at that level from 2016 to 2018.
By 2018, Marathon Oil was generating $3.2 billion in net operating cash flow, which outpaced $2.8 billion in capital expenditures. That left enough room to generate free cash flow to cover its dividend payments. Marathon Oil has an ongoing share repurchase program which consumed $0.7 billion of its cash pile last year. As Marathon Oil exited 2018 with a net debt position of $4.0 billion, the company arguably should have allocated those proceeds towards further debt reduction activities after allocating a lot of capital to debt reduction in 2017 ($1.8 billion on a net basis when including borrowings and repayments). Management plans on allocating $2.4 billion towards Marathon Oil’s capital expenditures this year, down from 2018 levels, which is expected to generate 10% company-wide oil production growth on an annual basis.
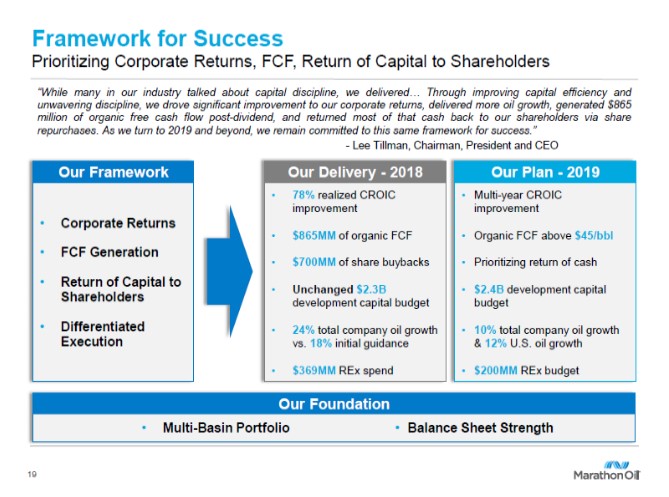
Image Shown: Marathon Oil’s battleplan for 2019. Image Source: Marathon Oil – Fourth quarter 2018 IR presentation.
Concluding Thoughts
While all three of the firms we covered today have promising growth prospects, those opportunities are only economical in a world where oil prices cooperate. All three of these firms sport sizable net debt loads, have been quite free cash flow negative in recent past, and have inconsistent net operating cash flow streams due to fluctuations in global oil prices. Generally speaking, all three firms are quality upstream operators and trade near the midpoint of their range of potential values, but there is still a lot that needs to be done before we would ever become interested in EOG Resources, Noble Energy, and Marathon Oil.
Oil & Gas – Independent: APA, APC, CHK, CLR, COG, DNR, DVN, EOG, EQNR, MRO, NBL, OXY, PXD, RRC, SWN
Related: XLE, VDE, XOP, ERX, OIH
—–
Valuentum members have access to our 16-page stock reports, Valuentum Buying Index ratings, Dividend Cushion ratios, fair value estimates and ranges, dividend reports and more. Not a member? Subscribe today. The first 14 days are free.
Callum Turcan does not own shares in any of the securities mentioned above. Some of the companies written about in this article may be included in Valuentum’s simulated newsletter portfolios. Contact Valuentum for more information about its editorial policies.