

To get started with your own copy of the Valuentum Dividend Growth Portfolio Retirement Model please visit http://www.valuentum.com/store/products/43
————————-
By Kris Rosemann
Dividend growth investing is a popular strategy for investors planning for their future. The Valuentum Dividend Growth Portfolio Retirement Model allows investors and financial advisors to plan for their and their clients’ retirement or other needs, and it sets out to do much more than what other simple dividend growth calculators do. By entering in just a few assumptions, a user can calculate a dividend growth portfolio’s total market value and annual income generation at an expected retirement date. The model has considerable functionality, allowing the user to factor in not only a company’s near and long-term expected dividend growth rate but also the quarterly reinvestment of growing dividends at a future expected stock price. The user can easily print the conclusions of their analysis, either for you and your clients. Let’s dig into the model in this quick how-to walk-though.
Step I: Enter Name, Current Date and Expected Retirement Date in Yellow Cells
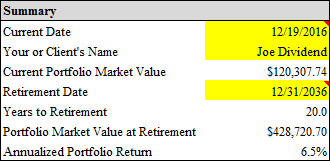
For the example that follows, we have input today’s date (at the time of this writing), the portfolio owner’s name (yes, we made this one up for illustrative purposes), and an expected retirement date (12/31/2036 in this case). Please be sure to set the inputs to specific information that reflect your or your client’s unique situation. In the Valuentum Dividend Growth Portfolio Retirement Model, cells that allow input changes are highlighted in yellow, while the others are locked for editing (to preserve the integrity and structure of the model) and are usually in white. The white cells represent outputs to the analysis. In this example, we assume client ‘Joe Dividend’ has roughly 20 years until he expects to retire.
Step II: Enter Portfolio Information in Yellow Cells (up to 30 companies)
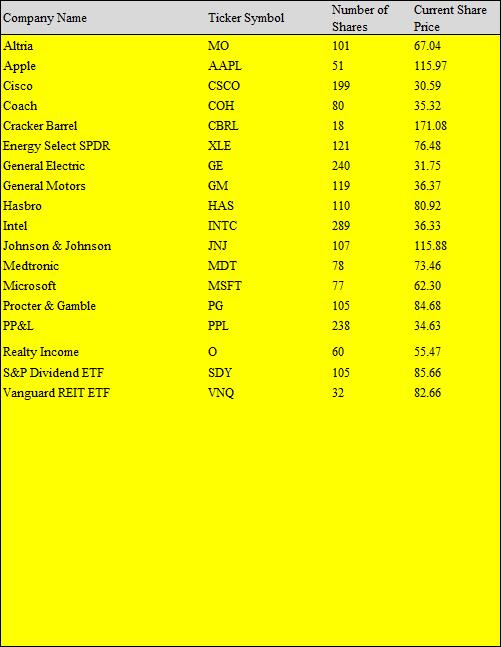
In this step, we input the company name, ticker symbol, number of shares and current share price for the holdings in the Dividend Growth Newsletter portfolio as of the December edition of the newsletter, which currently holds 18 companies and exchange traded funds (ETFs). For simplification purposes, we have excluded the cash balance of the Dividend Growth Newsletter portfolio, but you should include all holdings, including the cash portion, to generate as accurate of a future forecast for portfolio value as possible.
In the Valuentum Dividend Growth Portfolio Retirement Model (shown above), we include rows for up to 30 companies, ETFs, and other securities. Generally speaking, we think 30 securities is a sufficient number to pursue a dividend growth strategy, and especially within the context of a portfolio – any more may be adding incremental complexity with little to no diversification benefits. Just to reiterate, since the goal of this exercise is to display the functionality of the Valuentum Dividend Growth Portfolio Retirement Model, we have excluded the cash portion of the Dividend Growth Newsletter portfolio in this analysis.
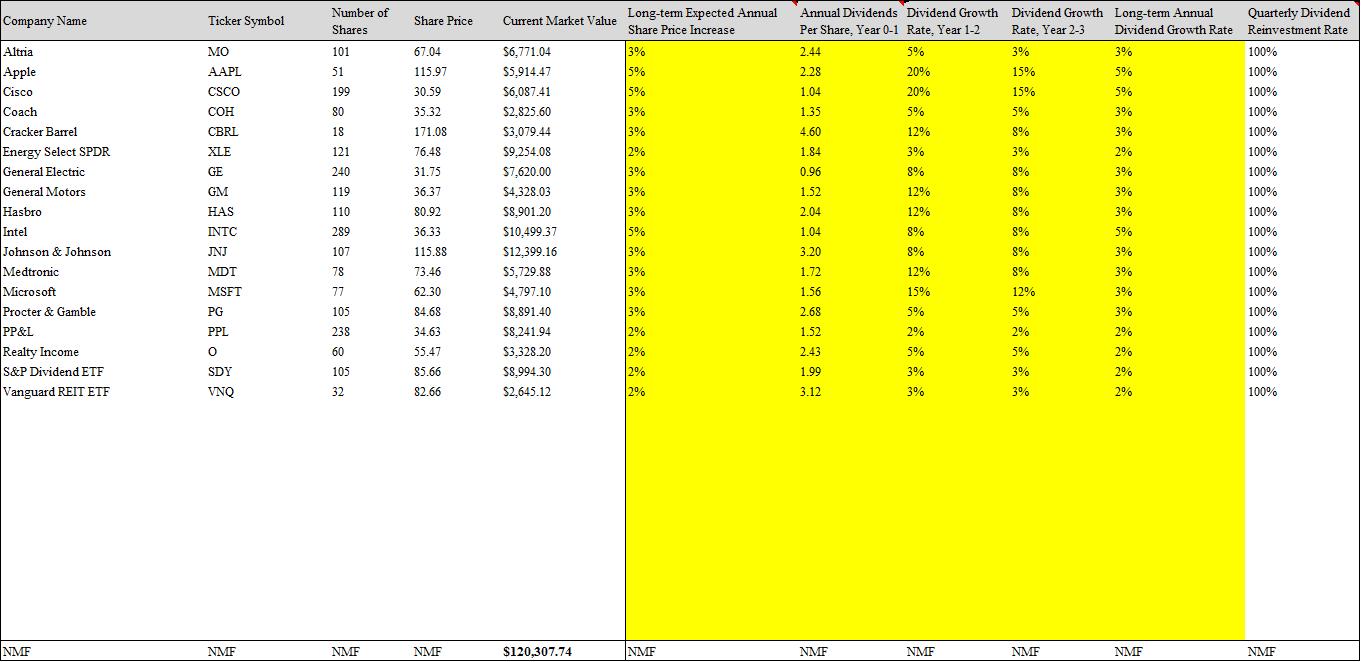
Step III: Enter Portfolio Assumptions in Yellow Cells
To get started with your own copy of the Valuentum Dividend Growth Portfolio Retirement Model please visit http://www.valuentum.com/store/products/43
Step III in the Valuentum Dividend Growth Portfolio Retirement Model is perhaps the most important and certainly the most rigorous. In this step, we input our expectations for future return performance of the holdings in the Dividend Growth Newsletter portfolio. Doing so can be a very challenging task, and one that involves more art than science, but using Valuentum’s resources on its website can help along the way.
The first input is titled ‘Long-term Expected Annual Share Price Increase,’ the first column of yellow cells. The inputs that you enter into these cells for each company should represent the percentage you think the stock price will increase each year over the long haul (not its total return, which includes dividends, but the change in the price of the stock). This can’t be predicted with certainty but it should still reflect your long-term expectation, which helps to build the model (setting capital appreciation trajectory, price at which dividends are reinvested). To reiterate, the measure to input in these cells is not a total return measure and should only represent your expectations of the long-term annual capital gain of the equity, excluding any dividend-related considerations (at this point in the model build). We’ll get to dividends later.
For most companies, we think a range of 0%-5% may be appropriate, and generally speaking, the higher the dividend yield, the lower the capital-gain portion of total return, all else equal. Remember – dividends are a portion of total return that reduces the capital gain component that otherwise would have been achieved. In the examples that comprise the Dividend Growth Newsletter portfolio, we generally assume a long-term annual share price increase rate of 2%-3%, a modest assumption but realistic assumption for most companies, but there are instances where 5% is applied. Said differently, the majority of the companies we include in the Dividend Growth Newsletter portfolio are of the large cap variety, and we expect their maturity to translate into relatively steady performance during the 20-year forecast horizon. However, we’ve made higher share-price-return growth assumptions for Apple (AAPL), Cisco (CSCO), and Intel (INTC) in light of the valuation opportunity presented by shares.
Good practice in setting these assumptions includes evaluating each firm’s 16-page report and any recent commentary from Valuentum on each stock’s landing page on the website (be sure to use the ‘Symbol’ search box). A consideration of its current valuation, expected earnings growth rates, and competitive advantages are just a few criteria to consider when setting this assumption. There is a great deal of helpful information in the individual 16-page reports, and sections such as ‘Growth Analysis’ on page 3 and ‘Margin of Safety Analysis’ on page 6 of the 16-page reports may be of interest for users making projections in the Valuentum Dividend Growth Portfolio Retirement Model. As these projects reflect more art than science, it is important to be mindful of the time horizon that you set when considering what values to input. Compounding returns over time usually end in unrealistic long-term outcomes, so be sure to think through whether the long-term rate you input is realistic over the time horizon you set for your retirement date.
Let’s take a moment to quickly discuss some of the considerations behind the assumptions for the ‘Long-term Expected Annual Share Price Increase’ column in our example model. For Altria (MO), we include a conservative 3% capital gain return for its long-term expected annual share price increase (again, this estimate excludes any dividend-related considerations for now). Sustainable earnings growth at the company is expected to come from product pricing power, even as global cigarette volumes remain under pressure. An increasingly health-conscious global society remains a key long-term risk, but its impressive share in both the cigarette and smokeless tobacco markets is hard to overlook, and we don’t think smoking will go away completely. A 10%+ equity interest in global beer giant AB InBev (BUD) provides additional financial flexibility to the company. Shares are fairly valued, so a GDP-like, inflation-like 3% estimate seems to make sense in this context.
In the case of Apple, we are comfortable assigning it a relatively higher expected annual share-price-increase rate due to our opinion of the competitive advantages of its impressive ecosystem and brand strength. The iPhone may not be the revolutionary technology it once was, but future iterations of the device should continue to propel Apple’s fundamentals higher as it explores higher growth avenues such as wearable technology, all while having a reassuring balance sheet with a net cash position larger than the market capitalizations of most other companies included in the S&P 500. Shares look cheap at the moment, offering the potential for outsize share price gains in the near term. In this case, we use the valuation opportunity as support for estimating a higher long-term capital return, excluding dividend-related considerations.
Cisco is another that receives a relatively high share price growth assumption. As with Apple, shares of Cisco look relatively cheap at the moment, offering some additional potential in the near term. So, not only do we think the near term will be bright, but the long-term growth story for Cisco remains its connection to the ongoing digital transformation in business and society. The applications of its cloud platform are vast, and while competition will remain stiff (as it always has been), the company is working to optimize its business as a software and subscription based model and is experiencing positive momentum, which we expect to carry over into meaningful long-term growth. As a result of these considerations, we give our estimate of Cisco a boost.
Coach (COH) receives what we would describe to be a ‘standard’ 3% long-term expected annual share price increase assumption, though this may be a bit generous in light of the fickle nature of demand for aspirational and luxury goods. Coach’s products are discretionary in nature, and as such, demand tends to be tied to the health of the overall economy/stock market (given the wealth effect), the disposable income levels of wealthy consumers, and the tourism markets. Changing fashion trends are a risk, as wearable technology has already started to hurt the brand strength of some of the most established companies. Although we’ve been generous with a 3% growth rate for this input for Coach, we believe a 1%-2% target may also be reasonable in light of the uncertainty a long-term horizon brings. As time passes, we’ll continue to monitor this and other assumptions, an exercise that is part of the update process.
Cracker Barrel (CBRL) is another example of a company that benefits most when disposable income levels are high. We love that the unique feel of the company’s restaurants sets it apart from competitors, and a reputation for fairly-priced, home-style meals sits well with consumers. Still, we have a difficult time assigning any restaurant stock a long-term expected annual share price growth rate above 3% in light of the competitive dynamics of the space. Further, the discretionary nature of eating away from home and the fickleness of the average American consumer are factors we tab as restricting a higher-growth assumption, even as we say that Cracker Barrel is one of our favorites across the restaurant industry.
We assign each of the three ETFs–Energy Select SPDR (XLE), S&P Dividend ETF (SDY), Vanguard REIT ETF (VNQ)–included in the Dividend Growth Newsletter portfolio a long-term expected annual share price increase of 2%, below what we would describe as the 3% standard, default setting. The lower assumption relative to baseline is largely a result of the ETFs’ inclusion of a high number of stocks, making long-term outperformance less likely than that of an individual equity. Said differently, a negative side effect of the ETFs that protect against downside risk is that upside potential is hindered. It is also no surprise that these securities include entities that generally have a high dividends yield, which itself is a one-for-one adjustment to the total return component of the stock (the share price is adjusted downward when a stock pays a dividend). Thinking about the size of the dividend yield for the security in the context of setting the input for the ‘Long-term Expected Annual Share Price Increase’ is an important one. Generally speaking, the higher the dividend yield, the lower the estimate should be in this column, all else equal.
General Electric (GE) is an interesting consideration in terms of our expectations for its long-term annual share price increase. The firm looks to be well positioned to be a top player in the growing Industrial Internet of Things, and its scale should help it outperform some smaller competitors in this area. However, it still has a massive industrial portfolio that is tied to a variety of end markets, many of which are cyclical in nature (oil and gas, for example). As a result, we’re assuming the firm’s share price will grow by roughly 3% annually over the next 20 years in our model example. It will have its ups and downs, but it will be difficult to make the case that GE will expand at a greater pace than global GDP for a long period of time.
The assumptions behind General Motors’ (GM) annual share price growth assumption require careful consideration of the regions it serves. While we expect somewhat stable performance in North America due to the mature nature of the auto market in the US, other regions of the world offer higher growth opportunities for the firm. Developing markets and the blossoming global middle class will soon require more new and improved vehicles, and a manufacturer with the scale and resources of GM can be expected to work to fill such demand. Further, GM is confident in its positioning for the next round of technology in mature markets, and it is already a major part of the competition in self-driving and electronic cars. We think a 3% long-term annual share price increase assumption is reasonable, despite the company’s troubled past.
Hasbro (HAS) is an interesting case in that its transformation to a licensing business model from a physical toy maker is what leads us to assume a 3% long-term annual share price increase. The company’s new capital-light business model is a clear positive from the transition, but it has also now brought its licensing agreements to the forefront. For example, recent performance had been driven in part by strength in products that were a result of an agreement with Disney’s (DIS) Frozen franchise. Should such relationships not be adequately maintained, performance could suffer. As a result, a more moderate long-term annual share price growth assumption is appropriate, in our view.
We assign Intel a 5% long-term annual share price increase, as we expect it to benefit from the digital transformation of society and industry, though in a different way than Cisco and GE. Intel’s prowess as a chip manufacturer, along with its enhanced scale as a result of the Altera acquisition, should help it take advantage of the massive demand expected to develop for a wide range of Internet-connected devices. We like the potential growth profile at Intel, and long-term growth in mobile looks very promising, even as Qualcomm (QCOM) remains part of the picture.
Johnson & Johnson (JNJ) is an example of a steady-eddy entity whose diverse portfolio ranges from consumer products to pharmaceutical products. Though a 3% long-term annual share price increase assumption may be a bit conservative for the firm when considering the potential embedded in its pharmaceutical pipeline, the risks that come with depending upon unapproved drugs for future growth are still rather high for us to assume a higher assumption (at this time). Still, J&J represents a case where we might ratchet up this 3% long-term forecast as we continue to receive more information about how all phases of its pipeline are developing in the future. Tweaking estimates as time progresses and as new information becomes available is part of the process.
Our assumptions for Medtronic (MDT) follow a similar line of thinking as that of Johnson & Johnson. The medical device giant has appealing scale and market share in an attractive industry, and we think this earns it a baseline 3% expectation for long-term annual share price increases alone. However, the company’s shares are fairly valued today, and in light of the challenges in forecasting medical-device breakthroughs in an ultra-competitive environment, we don’t give it a higher growth rate that it still might yet deserve. What we’re saying is that the expected annual share-price increase assumption for Medtronic may increase upon a future update, if both the company’s valuation opportunity and visibility into its long-term picture improve. As you can see, forecasting is as much art as it is science at times, and expectations should change. Nothing is static.
Microsoft (MSFT) is a unique consideration in the context of this example model. The company’s growing cloud business is experiencing strong momentum and looks to be a key player in the next generation of Internet capable and connected devices. However, while the growth potential we see in this area may be augmented by the acquisition of social media network LinkedIn, we feel the deal was an imprudent use of more than $26 billion in cash. If management continues to pursue deals with lofty purchase prices and meager free cash flow, value destruction may ensue. Microsoft’s current fair valuation and our concerns about expectations that it may misuse its huge cash balance, a large component of its existing value, is a key factor influencing our assumption of Microsoft’s long-term annual share price increase, which we have set at 3%. If management shows greater restraint in its acquisition program, we may raise this estimate, however.
The brand strength of consumer staples giant Procter & Gamble’s (PG) portfolio is second to none, and it is the core driver behind our 3% assumption for its long-term annual share price growth rate. The company’s products are not going away anytime soon, and their non-discretionary nature helps shield its business from economic weakness that can impact other business models. Though its valuation is not as attractive as it once was, we’re comfortable with a 3% assumption for P&G. As for our utility holding, the regulated nature of PP&L’s (PPL) utility business protects it from downside risk, though it also keeps it from substantial outperformance as rate base agreements with regulators set a cap on the rate of return utility companies are able to realize on their given rate bases. As a result, we assume 2% growth in its long-term annual share price. For most utilities, we think a 2% input for this assumption makes sense, as again, this figure does not consider dividend-related items.
We assume the same 2% long-term estimate for Realty Income’s (O) long-term annual share price increase. The real estate investment trust (REIT) business model provides some stability with respect to financial performance and dividend payments, but there are plenty of inherent risks that come with investing in REITs. For one, we do not expect REITs to outperform in a rising interest rate environment, as they are often held for income purposes. As US Treasury yields climb, the above-average dividend yields of REITs become less attractive from a risk/reward standpoint, and this may pressure capital returns as asset moves to riskless assets for yield. The larger dividend yield also detracts from pure share-price increases.
Now that we’ve explained our general thought processes in assigning annual share price growth expectations for each, excluding dividend considerations, it is important to note that the estimate for each company over varying retirement time horizons could also be different. For example, the annual share-price increase estimate for Apple on a one-year look-forward period may be substantially different than over a 30-year look-forward period, even though it is the same company. Clearly, there are a large number of factors to consider when setting assumptions, and many factors go well beyond our very short paragraphs.
The next input in Step III ‘Annual Dividends Per Share, Year 0-1,’ is much more straightforward. This column represents the current annual dividends paid by the company or ETF or those expected to be paid during the next full year. No forward-looking assumptions are necessary in this input, but we suggest using the most recent payout on an annualized basis for this input.
The next three input columns are very similar but also are different as they hone in on different time periods: ‘Dividend Growth Rate, Year 1-2,’ ‘Dividend Growth Rate, Year 2-3’ and ‘Long-term Annual Dividend Growth Rate.’ Valuentum’s dividend reports can be extremely helpful in setting these assumptions in the model. In the case of this example, we use the dividend growth projections found at the bottom of the ‘Dividend Track Record’ chart in the bottom right-hand corner of page 1 of each individual company’s dividend report (see image below) to approximate the assumptions for the first two explicit forecast periods in the Valuentum Dividend Growth Portfolio Retirement Model.
For the ‘Long-term Annual Dividend Growth Rate’ column, we think more normalized growth levels, similar to those in the ‘Long-term Expected Annual Share Price Increase,’ are more appropriate. Generally speaking, dividends like earnings, cannot grow faster than global GDP over