

Image Source: Toll Brothers
By Kris Rosemann
The underproduction of homes since 2008 has created pent-up demand, providing a material tailwind for homebuilders as of late. According to estimates from Toll Brothers (TOL), the total estimated shortfall of housing starts from the period 2008-2014 was 5.7 million. That equates to an annual shortfall in production of ~818,000 new homes, providing significant opportunities for the homebuilding group as a whole moving forward.
Pent-up housing demand has been accruing for years, and stronger general economic conditions, including lower unemployment, modest wage growth, and general consumer confidence continue to drive demand. A favorable jobs/wage market has the potential to provide a material boost for homebuilders, and additional demand could be found in the fact that an increasing percentage of adults ages 18-34 years old live with their parents, even more than during the Great Recession. If these young adults are able to accumulate wealth and potentially pay off student debt in a favorable job market, the housing market will benefit.
While pent-up demand and strong general economic conditions drive demand higher, land and labor shortages and the mortgage market constraining potential home buyers’ access to mortgages will continue to pressure supply. Financing will be particularly tough for young adults and first time home buyers due to ballooning national levels of student debt and credit issues. New home inventory is limited, which makes for an environment conducive to driving housing price improvements (as a result of simple supply/demand dynamics). Though we acknowledge the concept of ‘shadow inventory’—sellers currently without a ‘for sale’ sign in their front yard—overall inventory trends continue to move in a positive direction for homebuilders.
Recent price movements have provided empirical evidence for the favorable trends appearing in the housing market. The S&P/Case-Shiller Home Pricing Index showed a 5.4% year-over-year increase in January 2016, far more than recent inflation rates. Continued growth in existing home prices will encourage further activity in housing starts as well. According to the Index Committee at S&P Dow Jones Indices, there is a five-month supply deficiency in homes for sales in the US, meaning that potential sellers are encountering difficulty in trading up for larger homes.
However, this shortage may be beginning to change. Starts of single family homes in February 2016 were the highest since November 2007, and single family home share of total housing starts was 70% in February, compared to a low of 57% in June 2015 and 75%-80% share before the housing crisis. Total housing starts have remained above an annual run rate of 1 million starts per year since March 2015, yet another piece of evidence for the material tailwind homebuilders have been experiencing.
Recent performance at many of the major homebuilders also provides support for the dynamics outlined above, and backlog trends across the industry are pointing to continued growth for the group. DR Horton (DHI) reported homes in backlog growth of 15% in the first quarter of fiscal 2016, ended December 31, on a year-over-year basis, and value of net homes in backlog growing slightly faster at 16%.
In the first quarter of its fiscal 2016, ended February 29, KB Home (KBH) reported backlog units increased 22% while backlog value jumped 29% from the year-ago period. The firm’s number of orders in the quarter increased 4%, but net order value advanced 9%; average selling price in the quarter grew 5%. Lennar’s (LEN) average selling price increase in its first quarter of fiscal 2016, ended February 29, was an impressive 12% compared to the first quarter of fiscal 2015. Meanwhile, year-over-year backlog value growth of 19% outpaced units in backlog growth of 13%.
Despite the recent strength in volume and pricing, the capital intensive nature of the homebuilding business continues to suppress dividend potential in the industry. Inventory-management strategy is key to generating consistent free cash flow generation, and many companies have struggled doing so effectively and consistently to be steady dividend payers. Net debt positions are also common across the industry, and while industry veterans will say that leverage and the timing of cash flows is just part of the business, it may not matter. Companies with strong net cash positions and tremendous free cash flow capacity are much better choices for long-term dividend growth investors.
Homebuilders are not often dedicated to their dividends than traditional dividend payers either, with the exception of MDC (MDC), which has a yield of more than 4% and was one of a few builders that managed to preserve its investment-grade credit rating through the housing crisis of the late 2000s. However, despite having a “less bad” Dividend Cushion ratio, the firm’s dividend is far from safe, from our perspective. The chart below shows the hurdles to dividend health at the homebuilders, not the least of which are free cash flow pressures and ballooning net debt positions on the books.
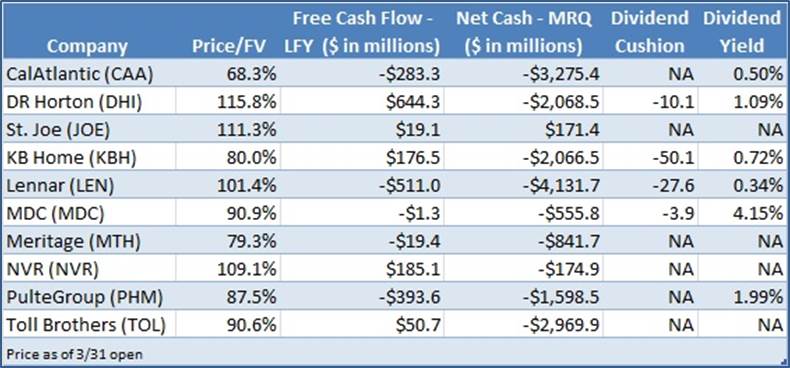
Though there may be further runway in the housing recovery in light of the factors mentioned in this article, we have very little interest in any homebuilder for the Dividend Growth Newsletter portfolio at this time. Logically stated, our best dividend growth ideas are those characterized by relatively strong balance sheets and material free cash flow generation–two dynamics the builders tend to lack. We wanted to get our thoughts out to you as soon as possible in case you get talked into buying a homebuilder’s equity for income purposes a full seven years after the March 2009 panic bottom in the S&P 500.
Homebuilders: CAA, DHI, JOE, KBH, LEN, MDC, MTH, NVR, PHM, TOL