
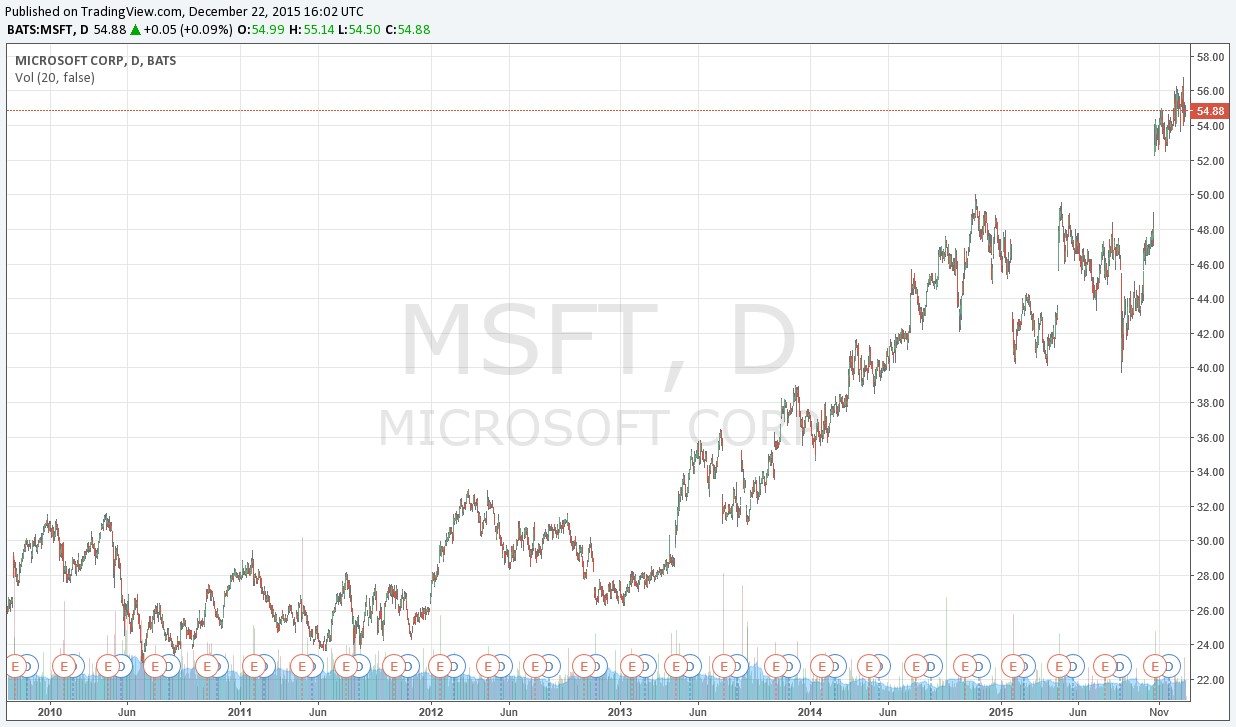
It’s sometimes difficult for companies to overcome a tarnished reputation, particularly when it comes to a spotty dividend track record, but also as it relates to equity performance. The stock market is often unforgiving at times. Microsoft (MSFT) had long been viewed as “dead money,” or a term that describes an equity that languishes in a small trading range for years. For example, from 2010 to the beginning of 2013 (at the time it was added to the Dividend Growth Newsletter portfolio), Microsoft had bounced around in the mid-$20s per share.
But as the chart below shows, overcoming a tarnished reputation is not impossible; in fact, Microsoft has put its “dead money” reputation behind it, powering past levels even witnessed during the height of the dot-com bubble in the late 1990s/early 2000s. Though shares have reached our fair value estimate, part of the Valuentum methodology focuses on letting our winners run until both value and technical/momentum indicators wane. In Microsoft’s case, the company still has meaningful upside toward the high end of the fair value range, and while shares could certainly close the recent “gap up” in the near term, the company’s technical/momentum indicators are about as healthy as it gets, in our view.
For most of the past few years, we traveled around the country to local American Association of Individual Investors (AAII) societies, explaining to investors the benefits of the Dividend Cushion ratio in assessing risks related to both the sustainability and growth of the dividend, using Microsoft as one of our favorite examples of a company that could increase its payout in a big way (it has). On the basis of several of the financial metrics below, we continue to believe the software giant is a “Dividend Aristocrat-to-be,” a company that we expect will put together an impressive streak of dividend increases for 20 years or more in the future.
On the other hand, to explain situations of poor dividend health (e.g. commodity-dependent, capital-intensive, and overleveraged entities paying out more than free cash flow and earnings as dividends), we used Kinder Morgan (KMI) and the master limited partnership model (AMLP), in general, as examples. The MLP business model has lost so much money for retirees over the past few years that we’re hoping (praying) the recent bounce in units will facilitate some sustained recovery. Many retirees may not be aware of the eroding characteristics of dividend/distribution payments to intrinsic value and the impact of a rising interest rate on the intrinsic valuation of the equities/partnerships. The long-term works against MLP units, in our view.
If you haven’t read our rebuttal, “Focus on ETE, not ETP, Strive for Balance and Stick to the SEC Filings,” to TheStreet’s ad hominem attack on the Valuentum analyst team, headed by Brian Nelson and Kris Rosemann, you can do so here. We’ll keep focusing on performing fantastic research and analysis to help investors of all types, and we genuinely hope things work out for ETE/ETP holders (we have no economic interest, long or short)! If you’re interested in reading more about Mr. Nelson’s call on Kinder Morgan’s share-price collapse and how our research and analysis can make a difference, please select, “Recapping The KMI Call Made By Valuentum’s Nelson, What Next?.”
As those that are familiar can attest, the Valuentum process is completely forward-looking, meaning we’re far more interested in companies that we think will increase their dividends in the future, than ones that have increased them in the past and may be pushing the limit, putting income investors at risk. A Dividend Cushion ratio below 1 indicates heightened risk with respect to the dividend payout, but we’re most concerned about companies that have a negative Dividend Cushion ratio. Please be sure to take a look at our list of “Dividend Yields to Avoid!” We update this list monthly and publish it at valuentum.com/ and in each monthly edition of the Valuentum Dividend Growth Newsletter. Many of the firms that have slashed their payouts were on this list before they cut the payout (and many suffered significant declines in their share prices).
What we like about Microsoft and most of big tech, including Cisco (CSCO) and Apple (AAPL) is their extremely healthy balance sheets. Where a company such as Energy Transfer Partners (ETP) has a massive long-term debt position of $27.5 billion, as of the third quarter of 2015, and a meager cash position of less than $1 billion, Microsoft, by comparison, at the end of September 30, had a total cash balance of nearly $100 billion relative to short- and long-term debt of ~$37 billion, good for well over $60 billion in net cash on the books to use to pay out the dividend, should traditional measures of free cash flow come under pressure.
That’s not all, however. In the third quarter of 2015 alone, Microsoft hauled in $8.6 billion in net cash from operations, while additions to property plant and equipment were $1.36 billion, good for more than $7 billion in positive free cash flow generation. The software giant paid out $2.5 billion in dividends during the period, revealing substantial excess coverage on the basis of free cash flow generation alone, even if we ignored its tremendous cash reserves. By comparison, cash flow from operations at Energy Transfer Partners was $2 billion through the first nine months of the year, while capital spending totaled $6.5 billion, good for a $4.5 billion shortfall (negative $4.5 billion). Yet, Energy Transfer Partners paid out $2.25 billion in distributions to partners! The MLP business model is about as risky as it gets, in our view, and we don’t think it is going to make it to the other end of this energy cycle.
Those that are in the pipeline business will say that such analysis is not how one should evaluate pipeline equities – they use industry measures of distributable cash flow, not to be confused with widely-accepted measures of discounted cash flow used in the valuation process – both going by DCF. But we also remember during the dot-com bubble when investors were valuing Internet equities burning through free cash on the basis of “eyeballs,” hits to the site. Investors know that cash is king — net cash on the balance sheet and traditional measures of free cash flow, as defined by cash flow from operations less all capital spending. Investors know that MLP accounting is far from transparent, and disclosures regarding non-GAAP free cash flow and GAAP measures of leverage will only help investors make better decisions. Why not include these measures on every press release? We think management teams should take lead in making sure investors are aware of these measures.
It should be no surprise that entities such as Microsoft, Apple and Cisco, which are overflowing with net cash on the balance sheet and generate traditional measures of free cash flow far in excess of dividends paid, are among the strongest dividend payers on the market. Their financial conditions fly in the face of more risky companies that have piles of debt on the balance sheet and run at a deficit in traditional free cash flow generation, but still pay out massive distributions. The latter is an unsustainable proposition, in our view. We’re sticking with tried-and-true investing principles and a focus on traditional measures of free cash flow.
You can learn more about our valuation process here.