
Kinder Morgan’s Credit Should Be Junk Status
The corporate’s investment-grade credit rating does not add up.
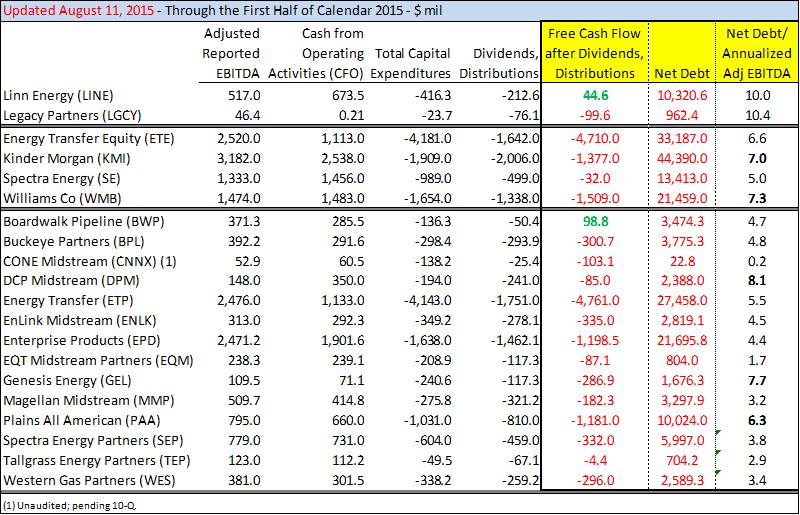
On a reported basis, adjusted for impairments, our estimate for Kinder Morgan’s (KMI) leverage is 7 times annualized first-half EBITDA, nearly a half turn greater than that of perhaps its closest peer Energy Transfer Equity (ETE), which is rated Ba2/BB/BB (Stable) by the credit rating agencies.
That’s two full notches below the lowest level of investment grade and Kinder Morgan’s credit rating, despite Kinder Morgan’s dividend obligations being $350 million more during the first half of this year alone (~$750 million annualized) relative to Energy Transfer Equity, and its absolute level of debt standing above any other on this list. Kinder Morgan’s plans to raise its dividend at a 10% annual clip each year through 2020 should make the corporate’s credit quality worse in this comparison, not better.
As a second data point, Standard & Poor’s assigns a corporate credit rating of BB+ for Williams Co (WMB), a company that we estimate as roughly 7+ times net debt to annualized EBITDA on the basis of first-half results. Though Fitch believes Williams’ credit is improving (BBB- ‘Rating Watch Positive’) and Moody’s has Williams’ Co’s ‘Ratings Under Review’ (Baa3), Kinder Morgan’s leverage metrics fall in between ETE’s BB and WMB’s BB+, yet the company is granted a BBB- rating.
Here’s where to find what we’re looking at. To locate Energy Transfer Equity’s (not Energy Transfer Partners) credit rating, go to page 3 of the presentation at the June 23, 2015, Credit Suisse conference (a) and underneath Energy Transfer Equity’, L.P, you’ll see the ratings by the agencies, Ba2/BB/BB (Stable). The first-half EBITDA information can be found by downloading each firm’s respective 10-Q, here (b) and here (c), for Kinder Morgan and Energy Transfer Equity, respectively. We add back impairment charges and D&A-related items to operating income to arrive at our measure of adjusted reported EBITDA. Go to William Co’s latest 10-Q (d) to get its data; its corporate credit ratings can be found on page 50. These links are at the end.
All in, at ~7 times net debt-to-annualized adjusted EBITDA, and with double-digit growth in cash dividend obligations expected through 2020, Kinder Morgan’s credit should be rated junk, in our view, especially when compared to Energy Transfer Equity’s metrics, which are a full two notches below those of Kinder Morgan, and those of Williams Co, which are split among the agencies. We’re talking 7 turns of leverage on a company that has commodity-price exposure (e). From an external investor’s perspective, asset quality can probably only be viewed as questionable at best in light of recent pipeline failures at the company specifically (here and here).
Once Bitten, Cash Flow Lessons Are Learned, But Only Then
Those MLPs that have cut their payouts have been the best cash managers.
What we find to be the most interesting development across the equity pipeline universe is that those that have demonstrated the best cash management through the first half of 2015 have been entities that have disappointed investors with respect to the distribution in the past.
On this list, only two master limited partnerships have generated positive free cash flow (after dividends/distributions paid), and both of these entities have cut their distributions to investors. Linn Energy (LINE) recently cut its distribution, despite generating nearly $45 million in free cash flow (after distributions) during the first half of this year, and Boardwalk Pipeline (BWP), which slashed its payout in early 2014, generated nearly $100 million in free cash flow (after distributions). We find that after the “MLP game” has played out for certain equities, executive teams tend to transform into better cash managers, opting to not throw away capital at any and all growth projects in hopes of having EBITDA finally catch up to a respectable fraction of their corresponding net debt loads.
From our perspective, the industry appears far from healthy. Barron’s reported (f) that Magellan Midstream (MMP) and Plains All American (PAA) are witnessing heightened competition across the space due to pipeline overbuilding, so it would seem that M&A may be operators’ only avenue to delever, as crazy as that sounds. But when entities that are 6.6 times leveraged seek to acquire firms that are more than 7 times leveraged, it speaks more of desperation than consolidation. We’re talking about Energy Transfer Equity’s recent bid for Williams. Combining two cash-deficient, overleveraged entities won’t make one cash-rich, financially-sound player. It doesn’t work that way.
Distributable Cash Flow is Not To Be Used In Valuation
The difference between cash flow from operations and distributable cash flow is astounding in some cases.
Distributable cash flow has the same initials as discounted cash flow (DCF), but these two measures cannot be more different. Distributable cash flow, for one, is a non-GAAP measure that executive teams across the pipeline universe disclose in their quarterly press releases, while discounted cash flow is used within the valuation process, traditionally as a form of enterprise free cash flow or free cash flow to the firm (FCFF). Annual enterprise free cash flow is calculated as earnings before interest (EBI), after taxes, less net new investment (total capex less depreciation) +/- operating working capital changes.
The reason why distributable cash flow, or the measure disclosed in press releases, cannot be used in valuation is at least three-fold:
1. It does not take into account growth capital spending. Within the valuation context, growth in any cash flow metric cannot be incorporated unless the growth capex associated with such growth is also deducted. It is a law of valuation, or else an imbalance exists within the framework. Distributable cash flow does not include growth capex, and therefore is not an appropriate valuation measure.
2. Distributable cash flow picks up near-term, unsustainable nuances that aren’t part of a company’s enterprise free cash flow stream over the long haul. For example, in Kinder Morgan’s case, the corporate’s distributable cash flow includes cash tax savings, which should not be factored into a perpetuity valuation, as Kinder Morgan will eventually pay taxes (just like any corporate). A long-term intrinsic value estimate considers a long-term cash tax rate, even if present results are artificially and temporarily bolstered by a lower cash tax bill. This is why relative valuation tables aren’t applicable in situations where long-term dynamics change across entities. You got it—Kinder Morgan’s long-term EBI needs to be tax-effected at the statutory rate within the valuation context.
3. Working capital changes matter. The team at Berkshire Hathaway (BRK.A) is famously against the use of EBITDA, oftentimes using colorful language to explain the measure’s pitfalls, and we agree. EBITDA is a horrible proxy for any form of cash flow (it considers no capex), and it certainly is a horrible proxy for operating cash flow, at least within the pipeline arena. Just look at the accounts receivable boost in Kinder Morgan’s first half (+$366 million, was $94 million), and the line item ‘Cash flow in operating assets and liabilities, net of effects of acquisitions and deconsolidations’ in Energy Transfer Partners first half (-$938 million, was +$361 million). What we find astounding is Energy Transfer Partners’ first-half GAAP net cash provided by operating activities is just $1.1 billion, compared to the $1.7 billion in distributable cash flow attributable to the partners of ETP, as adjusted. The timing of working capital shifts is important, and we have generally accepted accounting principles (GAAP) that define what ‘cash flow from operations’ is or should be.
Hope you enjoyed this piece. I can be reached at brian@valuentum.com for questions and comments. Thank you for reading!
(a) Credit Suisse conference slide deck Energy Transfer Equity
(c) Energy Transfer Equity 2Q 10-Q
(e) “For 2015, the company estimated that every $1 per barrel change in average WTI crude oil price will impact KMIs distributable cash flow by approximately $10 million, and each $0.10 per MMBtu change in the average price of natural gas will impact distributable cash flow by approximately $3 million.” – KMI second-quarter release
(f) Barron’s