
We knew something was terribly wrong. IBM’s (IBM) earnings quality had been waning, and we thought a big miss might be on the horizon. We wrote here in January 2014:
Never did we ever think we’d be using Big Blue as an example of poor earnings quality, but its fourth-quarter 2013 results, released January 21, fit the mold.
The first is revenue growth. IBM’s fourth-quarter 2013 revenue dropped 5.5%, a pace that exceeded that of the 4.6% drop for the year, indicating an acceleration of the revenue decline. We’re viewing this as a sign that the worst may still be ahead of Big Blue as it tries to steer the company back to growth. Without a solid backdrop of revenue growth, earnings-per-share expansion will have to come either from lower quality cost-cutting, one-time items, or share buybacks. Interestingly, IBM didn’t cut operating costs faster than the revenue declines in the period, as SG&A and RD&E as a percentage of revenue expanded, to 21.6% (up 140 basis points) and 5.7% (up 30 basis points), respectively. Clearly, revenue and costs are moving in the wrong direction at IBM.
But IBM still reported a 6% increase in net income and a 240 basis point improvement in its net income margin for the quarter (see bottom two lines of the image above). Let’s examine how it did so by looking at the two other encircled items on its income statement. ‘Other (income) and expense’ advanced by $66 million—the measure is an offset to expenses, which is why it is a negative. Second, IBM’s tax rate (‘Effective tax rate’) tumbled significantly. Big Blue’s net income was more than $1 billion higher than it otherwise would have been (the ‘Provision for income taxes’ declined more than 60%). Given the declining revenue, increasing costs, and the one-time items that have benefited the firm (other income and a lower tax rate), the company’s earnings quality in the fourth quarter was very poor.
The quality of earnings expansion, however, was muddied even further. IBM bought back more than 50 million shares of stock (1,072.5 million versus 1,124.7 million), which further boosted headline earnings per share. On a diluted basis, IBM recorded 11% earnings-per-share growth, but there wasn’t anything fundamental in the quarter that should have driven such strong bottom-line expansion. Said differently, the buybacks acted as an artificial means to hide weakening underlying fundamentals.
Another important consideration in assessing earnings quality is to ascertain whether cash flow from operations is increasing at a pace (or is at a level that is) consistent with net income expansion. If it isn’t, then the earnings the firm is posting on the income statement are more accounting-based than cash-flow based. For IBM, net cash from operations per GAAP is slightly higher than accounting earnings on the income statement (in the quarter and on an annual basis), so the possibility of any serious financial shenanigans at Big Blue is remote, in our view. On an annual basis, however, the decline in net cash from operating activities ($18.79 billion versus $22.49 billion) was much steeper than the fall in net income for the year ($16.5 billion versus $16.6 billion). Free cash flow trends weren’t that great either. As a percentage of net income, free cash flow fell to 91.1% in 2013 from 110% in 2012. The pace of the free cash flow decline was much steeper than that of net income on an annual basis.
Still, the steeper drop in cash flow (both operating cash flow and free cash flow) relative to the fall in net income shouldn’t be that surprising. A look at the breakdown in incentive compensation in IBM’s proxy statement reveals more of a focus on operating net income (60% weighting in executives’ annual incentive program) and operating earnings per share (an 80% weighting in executives’ performance share unit program) than anything else. See page 34 of 2013 proxy statement here and/or image below. As shareholders, we often get what we incentivize management to do.
Valuentum’s Take
As a matter of better corporate governance, we’d like to see a greater focus on return on invested capital (ROIC) and economic profit (EVA) than accounting measures at IBM. We think long-term performance will benefit from this re-focus. IBM didn’t engage in any large re-classifications to complicate year-over-year comparisons, but the firm’s quarterly results fly in the face of what we and the Research Center for the CFA Institute characterize as high-quality earnings. The fourth quarter 2013 was not (1) reflective of current operating performance, (2) a good indicator of future operating performance, and (3) helpful in assessing the intrinsic value of the company. We wouldn’t be interested in looking at shares of IBM until it fell towards the lower end of the fair value range (see its 16 page report). The best ideas are always included in the Best Ideas portfolio and Dividend Growth portfolio.
IBM announced poor third-quarter results Monday that showed revenue falling 4% and diluted non-GAAP operating earnings dropping 18%. The firm’s non-GAAP operating margin slipped 90 basis points. Though there were some bright spots in the quarter including cloud revenue advancing 50% year-to-date and mobile revenue doubling year-to-date, the quarter was bad. Even revenue from markets that IBM classifies as growth markets fell 6% during the quarter. Sales in BRIC countries dropped 7%. IBM acknowledged its own failure to execute:
We are disappointed in our performance. We saw a marked slowdown in September in client buying behavior, and our results also point to the unprecedented pace of change in our industry. While we did not produce the results we expected to achieve, we again performed well in our strategic growth areas – cloud, data and analytics, security, social and mobile – where we continue to shift our business. We will accelerate this transformation.
The company no longer expects to achieve $20 in operating earnings per share in 2015. We think the situation at IBM will get worse before it gets better, and we have no interest in shares, regardless of the Oracle of Omaha’s opinion (BRK.A, BRK.B).
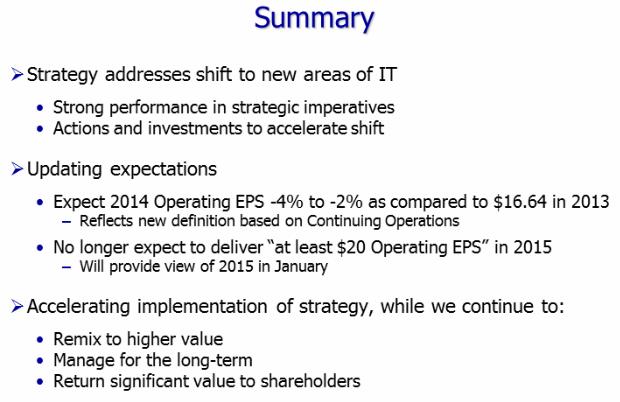
Image Source: IBM