
By Brian Nelson, CFA
What does straight up look like, you may ask?
Try the S&P 500 (SPY) since the fourth quarter of 2011.
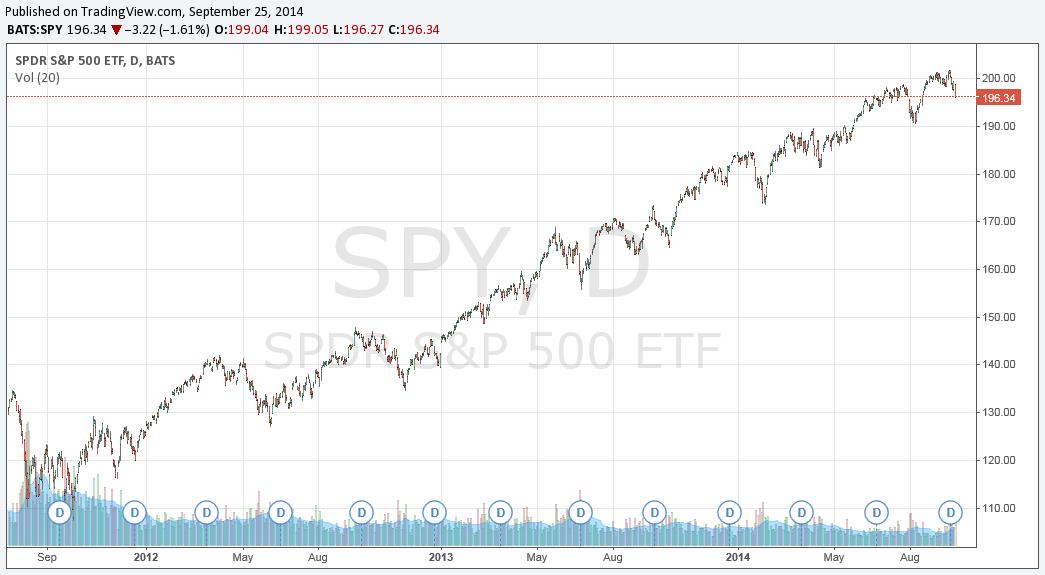
Today marked the largest sell-off in stocks since July 31 of this year. The Dow fell 1.5% to 16,952, the S&P 500 dropped 1.6% to 1966.27, and the Nasdaq tumbled 1.9% to 4,456.75. The S&P 500 tripped below its widely-followed 50-day moving average, and the large cap index is now back to levels reached months ago. All 30 Dow components fell during today’s trading session, with only a handful keeping the losses to less than a percent. Did you remember to build an arc like Bill DeShurko?
What more does the market have to prove? The S&P 500 has already eclipsed 2,000 just days ago, and the soothsayers with their arbitrary targets have now been proven correct. What incentive is now left for the banks, investment houses, and trading desks with their individual prognosticators and well-publicized gurus to push the markets to higher levels? The markets have already breached 2,000 and are now pulling back. The brokerage houses can tell (and probably have been telling) their clients and prospects how right they’ve been. What a great call!
Why not now advise clients and prospects to take the money and run? I can hear them already: “Book the gains for another day, and ward off the frightening month of October, home of the Black Thursday (October 24, 1929) and Black Monday (October 19, 1987).” But we (and they) all know that talk is just superstition. After all, the Flash Crash was May 6, 2010 – not October. We all know better than believing in such things. Or do we? And if we don’t, is that enough to drive such selling where a correction does occur? Ah…market psychology.
What’s more, the high-flying S&P 500 performance has eluded 4 out of every 5 large cap managers, which are trailing the S&P 500 return thus far this year. You heard that right: 80% of them are underperforming. The benchmark, they say, has flat-out gotten ahead of itself. So then, will active managers seek to push the index ever higher and drive even more of a relative underperformance gap? Or will they continue to wait patiently for a pullback? Putting to work a bit of dry powder on the dip will not have as much of a bang than watching the market fall to close the relative underperformance (or at least make their returns look more acceptable).
The market technicians are yelling: we haven’t had a 10% pullback in nearly 1,100 days. That’s right: 1,100 days without a technical correction. Many strategists have called the multi-year ‘straight up’ market behavior as simply unnatural—yet these same market strategists continue to champion higher price targets for the index. This hedging language is not uncommon, but it sure is getting old. Did you remember to turn off the TV? Most market strategists will tell you that the S&P 500 typically ‘corrects’ roughly every year and a half. Typically. It’s been nearly three years since we’ve had one.
The tangible fear is that the correction, when or if it does come, will be much greater than a relatively mild 10% pullback that traditionally defines a correction. According to FactSet, “the current 12-month forward P/E ratio is 15.6. This P/E ratio is above the 5-year average (13.5) and the 10-year average (14.1).” In this light, the market is certainly not cheap, even if one argues that it is not bubbly (though small caps are slowly deflating). Market veterans know that what can overshoot to the upside can also undershoot to the downside. Have we already forgotten about the March 2009 bottom? Are we already blocking out that pain? It seems too early for a new generation to have taken the reigns to cause another meltdown? Or is what we are experiencing the opposite, a melt-up?
Okay. What does all of this mean? Well, it means that we’ve come a very long way from the depths of the Great Recession years ago, and the market advance has been so orderly that one might even call the game rigged to the upside. I can hear some of my former colleagues ringing in my ears: “It’s the plunge protection team at work.” Some might call this team the Fed with their never-ending loose money, but those days will inevitably end. They will. They have to.
My humble view is that we will inevitably engage in a market correction of 10% or more, and the pullback starting this week may just be it. We won’t, however, have more to worry about until key interest rate levels cross the thresholds of many of the higher-yielding dividend stocks. Some advisors have become all too comfortable with dividend growth portfolios in the face of this wonderfully sanguine and cooperative market and may be caught off guard when competing and lower-risk, equal-return alternatives surface. I think higher rates may actually do more harm to the stock market than real negative rates, as in the case of deflation. Until that time, the game plan remains the same for both portfolios.