
A portion of this article is excerpted from the January 2014 edition of the Dividend Growth Newsletter.
Valuentum has two actively-managed portfolios: a Best Ideas portfolio and a Dividend Growth portfolio. Each portfolio has different goals and strategies.
The Best Ideas portfolio seeks to find firms that have good value and good momentum characteristics and typically holds them from a Valuentum Buying Index rating of a 9 or 10 to a rating of a 1 or 2. The goal of the portfolio is to generate a positive return each year and to exceed the performance of a broad market benchmark. The Dividend Growth portfolio seeks to find underpriced dividend growth gems that generate phenomenal levels of cash flow and have pristine, fortress balance sheets, translating into excellent Valuentum Dividend Cushion scores. The goal of the portfolio is to generate a mid-to-high single digit annual return over rolling three-to-five year periods.
The first part of this two-part series, released December 24, covered the holdings in the portfolio of the Best Ideas Newsletter. That research piece can be accessed here. The second part of the two-part series, written below, covers our thoughts on the outlook for dividend growth investors in 2014 and the holdings in the portfolio of the Dividend Growth Newsletter. We consider the holdings in both of the actively-managed portfolios our best ideas.
<< The Best Ideas for 2014 and Beyond: Part I
Dividend growth investors are enjoying a time like no other in the history of the equity markets. The attractiveness of dividend growth investing as a style has prompted companies to reevaluate their entire capital allocation decisions, and some firms’ boards have even decided to implement material step-ups in dividend payouts. Dividend increases (second column from left) in 2012 and 2013 have been the most in more than a decade and maybe longer.
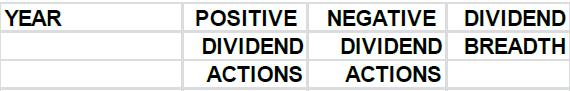
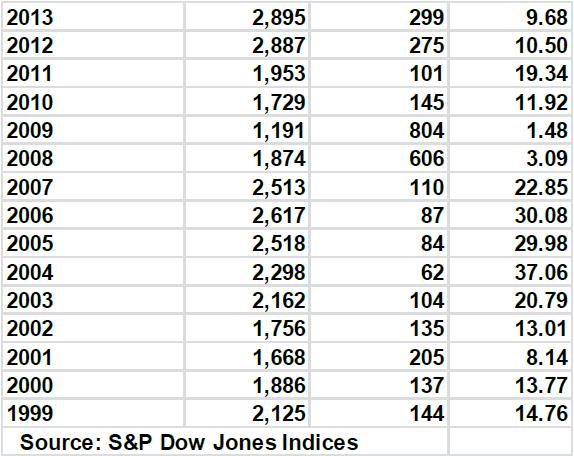
Image Source: S&P
For the most part, earnings expansion has supported the pace of dividend growth in 2013, and just like business owners that enjoy increased operating cash flow, dividend growth investors are enjoying increased dividend payments. For example, S&P 500 had this to say about the fourth quarter of 2013 and the year as a whole:
“S&P Dow Jones Indices announced today (January 6, 2013) that dividend net increases (increases less decreases) rose $12.7 billion during the fourth quarter of 2013 for U.S. domestic common stock, compared to an $8.4 billion increase in the fourth quarter of 2012…up 36.4% from the 649 companies which raised dividends in 2011. For the year, 2,895 issues increased their dividend rate, slightly up from the 2,887 which did so in 2012, but up over 48.2% from the 1,953 increases of 2011. (Source: S&P Dow Jones Indices, January 6, 2013)”
But while it’s been a great experience for the dividend growth crowd the past few years, dividend growth investors will face some unique risks in 2014. The markets are ushering in the year with an aggregate price-to-earnings ratio of roughly 15 on S&P 500 constituents, a level above both the 5-year and 10-year averages (see Part I here). The 10-year Treasury has just recently hit the highest level since July 2011, a sign that a) yields on new bond issuances will act as heightened competition for income and b) discount rates applied to equities will increase, pressuring fair value estimates. Investors should not be surprised if overvalued dividend growth entities face pricing pressure in 2014, especially if yields begin to rise and certainly if price-to-earnings ratios contract toward 5- and 10-year averages.
In this environment, it will be very important for dividend growth investors to continue to focus on the underlying cash-flow dynamics of the businesses they’ve invested in and their respective Valuentum Dividend Cushion scores—a cash-flow coverage measure of the health of the dividend. After all, dividends are paid in cash, and earnings are but a component of cash flow. There have been a plethora of instances where healthy payout ratios have been poor indicators of dividend health (see here and in particular Cliffs Natural example). Still, on an aggregate basis, payout ratios of US domestic stock firms are near lows at about 36%, which compares to the historical average of 52%. For healthy cash-generating firms—companies with high Valuentum Dividend Cushion scores—dividend increases should continue to be expected into 2014 and beyond.
But despite the healthy outlook for dividend increases, in aggregate, assessing valuations and applying an appropriate margin of safety on individual securities will remain paramount. According to S&P, the weighted average dividend yield declined to 2.44% in the fourth quarter of 2013 from 2.6% in the third quarter and 2.8% at the end of 2012 – the declines driven by the strong stock market price increases. In overvalued stocks (ones with price-to-fair value ratios above 1) in the Dividend Growth portfolio, we do not expect to allocate any new capital to them this year, even if the markets continue to race higher. We would find that to be an irrational move, not supported by underlying cash-flow fundamentals and harmful to long-term performance. For underpriced holdings, we’ll look to add to the positions opportunistically.
Though the markets are making the hunt more difficult for dividend growth investors, we will continue to look to undervalued, dividend growth gems for the Dividend Growth portfolio for new additions—companies like Microsoft (MSFT) and Apple (AAPL) that are significantly underpriced. These two tech giants, for example, have mountains of net cash on their balance sheets and generate gobs of free cash flow (operating cash flow less capex), making them fantastic dividend growth ideas over the long haul. We find potential ideas for the Best Ideas portfolio much more plentiful at this point in the stock market cycle, particularly as dividend growth investing becomes increasingly more popular. As we outlined in Part I of this series, prudence in allocating new capital in 2014 will be critical in any case across any strategy.
Our Best Ideas
We cannot recommend that you buy, sell, or hold any stock because we are not aware of your personal financial situation, goals and risk tolerance. This is how our business works. However, the following stocks are our best ideas heading into 2014. For a discussion of the best ideas in the portfolio of the Best Ideas Newsletter, click here.
Please note that the list below is a continuation of the Our Best Ideas segment of Part I and includes only our best dividend growth ideas, constituents of the Dividend Growth portfolio. A discussion of the best ideas in the Best Ideas portfolio can be found in Part I of this series. References to Part I below refer to the companies that are included in both actively-managed portfolios, and a rehashing of the discussion is omitted in this piece for brevity. Valuentum Dividend Cushion scores are as of the publish date of this article, January 8, 2014.
Dividend Growth Portfolio
Altria (MO) – Dividend Cushion: 1.2; Dividend Yield: 5.1%
See Part I.
Apple – Dividend Cushion: 2.9; Dividend Yield: 2.3%
See Part I.
Chevron (CVX) – Dividend Cushion: 2.1; Dividend Yield: 3.2%
Chevron’s third-quarter performance wasn’t fantastic, but the firm boasts the strongest balance sheet among energy majors by a landslide (its net debt position is practically negligible). This affords Chevron tremendous strength and flexibility during the depths of the energy cycle to continue raising its quarterly dividend payout and/or scoop up assets at depressed prices. In a commodity-producing industry, we view unrivaled financial flexibility as a necessity for future dividend growth.
Emerson Electric (EMR) – Dividend Cushion: 2.3; Dividend Yield: 2.5%
Not only did diversified industrial firm Emerson register record operating cash flow of $3.65 billion and robust free cash flow of $3 billion during its fiscal 2013 (ending September) when it reported fiscal fourth-quarter results–both above original expectations–but the board recently upped the firm’s quarterly dividend 5%, to $0.43 per quarter ($1.72 per share annualized). Fiscal 2013 marked the 57th consecutive year the firm has increased dividends, and while the 5% dividend increase may not be something to write home about, significantly better-than-expected cash-flow performance suggests to us that additional raises may be just around the corner.
Energy Transfer (ETP) – Dividend Cushion: 3.3; Dividend Yield: 6.5%
Energy Transfer Partners’ distribution growth has returned to life after years of being dormant. The company’s recent acquisitions (ETE’s 60% interest in ETP Holdco) have facilitated a distribution coverage ratio in the third quarter that hasn’t been this high in some time. ETP continues to invest primarily in fee-based midstream and NGL projects that will further improve distributable cash flow in coming periods. We believe ETP has an attractive portfolio of assets (it owns and operates approximately 43,000 miles of natural gas, natural gas liquids, refined products, and crude oil pipelines), and the master limited partnership remains a core holding in the portfolio of the Dividend Growth Newsletter.
General Electric (GE) – Dividend Cushion: 2.1; Dividend Yield: 3.2%
See Part I.
Hasbro (HAS) – Dividend Cushion: 1.9; Dividend Yield: 3%
We were encouraged by Hasbro’s performance in the third quarter and continue to believe that the proclaimed “death” of toys is overblown. For one, strength in the firm’s ‘International’ segment and emerging markets speak to the sustainability of the firm’s world-class brand portfolio. As Hasbro continues to experience modest sales increases as it pursues cost-cutting initiatives, we expect operating profit to continue to move higher. We continue to prefer Hasbro over Mattel (MAT) on the basis of our Valuentum Dividend Cushion score, and the firm remains a core holding in the Dividend Growth portfolio.
Intel (INTC) – Dividend Cushion: 2.0; Dividend Yield: 3.5%
See Part I.
Johnson & Johnson (JNJ) – Dividend Cushion: 2.2; Dividend Yield: 2.9%
Johnson & Johnson’s third-quarter results showcase why we continue to like the company. The firm has built one of the most comprehensive bases of health-care businesses, generating approximately 70% of revenue from top positions in its respective markets. Its pharmaceutical portfolio remains impressive, with REMICADE having 16 indications and 75% share of the US market for IV immunology products. Plus, REMICADE has exclusivity through 2018 in the US. STELARA and SIMPONI are other key profit drivers that we’re watching closely. We continue to hold this dividend gem in the portfolio of the Dividend Growth Newsletter, and we’re comfortable paying up for quality in J&J’s case.
Kinder Morgan (KMP) – Dividend Cushion: 1.3; Dividend Yield: 6.7%
We’re huge fans of Kinder Morgan Energy Partners’ stable fee-based cash flow (more than 80% of its business) and note that its asset footprint is unmatched. It remains one of our favorite income ideas, and we would not be surprised if we see upside to the expected distribution of $5.58 per unit in 2014, an approximate 6 percent increase over its 2013 budget target of $5.28 per unit and an approximate 5 percent increase above its current expectation of $5.33. Kinder Morgan Energy Partners represents a core position in the portfolio of the Dividend Growth Newsletter.
Medtronic (MDT) – Dividend Cushion: 2.5; Dividend Yield: 2.0%
Medtronic is a global leader in medical technology. We were very encouraged by stabilizing signs in the Implantable Cardioverter Defibrillators (ICD) market, which not only bodes well for Medtronic but also for peers St. Jude (STJ) and Boston Scientific (BSX). Though Medtronic’s dividend yield isn’t as large as that of others in the portfolio of the Dividend Growth Newsletter, the company’s financial strength and solid free-cash-flow generation speak to years of future dividend increases. We don’t intend to make any changes to the weighting of the firm in the Dividend Growth portfolio at this time.
Microsoft (MSFT) – Dividend Cushion: 3.3; Dividend Yield: 3.1%
Microsoft continues to be a no-brainer. The firm has robust free cash flow, a rock-solid balance sheet, and significant revenue and earnings growth potential. As we continued to pound the table on shares for much of the past two years—the company is one of the largest weightings in the portfolio of our Dividend Growth Newsletter—others said Microsoft was “dead money” and would continue to be. Though a search for a new CEO has increased uncertainty a bit, the company continues to hover around multi-year highs.
Proctor & Gamble (PG) – Dividend Cushion: 1.4; Dividend Yield: 3.0%
Procter & Gamble boasts some of the most recognized branded consumer packaged goods. Though the markets in which its products are sold are highly competitive, the firm is well positioned in the industry and holds a significant market share position. We continue to hold shares of Procter & Gamble in the portfolio of our Dividend Growth Newsletter. Even if top-line revenue growth isn’t robust in fiscal year 2014, we think cost savings and productivity improvements will lift cash flow generation and the firm’s dividend.
PP&L (PPL) – Dividend Cushion: Diversification considerations; Dividend Yield: 4.6%
PPL’s predominantly rate-regulated business mix offers support for the firm’s current dividend and provides it with a platform for future growth. We expect PPL’s regulated compound annual rate-base growth to be an impressive 8% in coming years. Though the regulated rate of return on investment provides stability to the earnings of utilities, hefty dividend payouts coupled with large debt loads to finance regulated projects often leaves little room for operating error as it relates to covering the dividend. This is why we view exposure to the utility industry in our Dividend Growth portfolio as a diversification maneuver rather than any methodology-driven tactic. Most utilities have poor Valuentum Dividend Cushion scores by definition. Exelon’s (EXC) recent dividend cut not only supports our methodological dividend framework for utilities, but also is a real-life example that showcases why utility dividends aren’t always safe.
Phillips 66 (PSX) – Dividend Cushion: 2.8; Dividend Yield: 2.0%
We hold Phillips 66 in the portfolio of our Dividend Growth Newsletter (following its spin-off from ConocoPhillips, which had been a holding), but we are evaluating an exit point in shares given deteriorating earnings. The firm’s operating (crack spread volatility) and financial risks (balance sheet leverage) have become too great for us at current pricing levels. Shares have more than doubled since being added to the Dividend Growth portfolio. While we hold shares, we’re looking for an opportunistic exit.
Realty Income (O) – Dividend Cushion: 1.8; Dividend Yield: 5.8%
Dubbed as the ‘Monthly Dividend Company,’ real estate investment trust (REIT) Realty Income is a core position in the portfolio of the Dividend Growth Newsletter. The REIT continues to diversify its tenant base, with the largest 15 tenants now accounting for 44.4% of portfolio rental revenue (down from more than half). FedEx (FDX), Walgreens (WAG), Family Dollar (FDO) and LA Fitness are its four largest tenants. The entity’s exposure to convenience stores has also fallen to 11.2% of the portfolio at the end of the period from 18.5% at the end of 2011. The REIT has also reduced its dependence on casual dining restaurants (now 5% of rental revenue; was more than 13% in 2010). We like how things are progressing at Realty Income, and we may opportunistically add to our position on weakness.
<< The Best Ideas for 2014 and Beyond: Part I
Related Tickers: DVY, IDV, VIG, SDY, VYM, SDIV, HDV, SCHD, DWX, KBWD, PID, DES, DTN, PEY, SPHD, DIV, DHS, DLN, LVL, DTD, DGRW, DON, FDL, FVD, PFM, FGD, DOO, NOBL, DOL, SDYL, DVYL, DEW, IDOG, HGI, DGRS, DNL, DGRE, DVYA, RDIV, QDF, QDEF, QDYN, EMDG, IQDF, IQDY, IQDE, WDIV, FIEG