

Stocks mentioned in this edition: Airbus (EADSY), Anthem (ANTM), Boeing (BA), Canada Pacific (CP), Chipotle (CMG), Cigna (CI), CSX (CSX), International Flavors & Fragrances (IFF), Lockheed Martin (LMT), NextEra (NEE), Rockwell Collins (COL), Stanley Black & Decker (SWK), Ulta Salon (ULTA), Union Pacific (UNP), UnitedHealth (UNH), Utilities Select Sector SPDR ETF (XLU), Vulcan Materials (VMC), W. W. Grainger (GWW)
Chipotle Not Showing Signs Of Recovery
What we originally believed to be a transient issue has turned into an extended public relations nightmare for fast-casual restaurant chain Chipotle (CMG). Though we do not necessarily question the safety of its food, we view its brand as damaged and the potential reward that would come along with a return to favor in the eyes of consumers is not worth the risk that the firm never comes out from under the shadow of the headlines that have plagued its results. Consumers are slow to forgive.
Chipotle has yet to show any real signs of a recovery from the food safety scandal that rocked its world in 2015. Comparable store sales fell 22% on a year-over-year basis in the third quarter of 2016, a continuation of recent trends and exemplary of the unforgiving nature of consumers when it comes to food safety and product quality.
Customers are simply not coming back at a rapid pace after the 2015 scandal, as comparable transactions fell 15% in the quarter, which helped shrink restaurant-level operating margins to half the magnitude of that of the year-ago period. Promotional gimmicks have not been enough to re-establish the allure the firm had as recently as mid-2015.
Activist investor Bill Ackman’s hedge fund Pershing Square Capital Management, is the second largest shareholder of Chipotle, with its stake coming in just under 10%. Ackman reportedly believes the firm’s board is long overdue for major adjustments and that it needs to ramp up marketing spending, cost controls and information technology capabilities.
Management has recently stated its plans to invest in digital ordering and payments, increase cost cuts, and will pursue other strategies for its ShopHouse Southeast Asian Kitchen concept after recording an impairment charge on its assets. While we do not disagree with Ackman’s line of thinking, we believe at this point in time it will take more than improved ordering and payment technologies and cost cuts to fix what is truly wrong at Chipotle.
There is no question that Chipotle could right the ship very soon and get back on the track it was on only a little more than a year ago, but we are having trouble getting behind the firm, even at such relatively suppressed price levels, with such uncertainty surrounding it. Management expects declines to moderate substantially (low single-digit declines are expected) in the fourth quarter of 2016 before returning to significant growth in 2017 (high single-digit growth is expected), but we have a difficult time buying into such a stark turnaround.
Further, the company has set its expectations for 2017 earnings per diluted share at $10, indicating that shares are changing hands at nearly 40 times 2017 earnings. For a company currently surrounded by such a high level of uncertainty with the recent past of Chipotle, this is simply too high to entice us.
International Flavors Offers Unique Exposure, Modest Income
International Flavors & Fragrances (IFF) is a leading provider of “sensorial experiences” from taste to smell to touch, and its share within flavors and fragrances (~16%) and cosmetic actives (~4%) speaks to its competitiveness. Flavor and fragrance compounds, fragrance ingredients, and cosmetic actives amount to a global industry of ~$20 billion, expected to grow by 2%-3% annually through 2020. Adjusted operating profit has advanced nicely since 2011, and annual adjusted operating profit margins have been 20%+ more recently.
Management is looking for annual 4%-6% currency-neutral sales growth and 10% currency-neutral EPS growth through 2020, goals we like a lot, but the company will also be active on the M&A front – targeting $500 million to $1 billion of sales via acquisitions by 2020, which could eat up capital that otherwise could enhance the dividend. In fact, its September 2000 deal with Bush Boake Allen (16 years ago) and a share buyback program were the primary drivers behind the dividend cut back then.
Free cash flow has averaged ~$325 million (2013-2015), roughly double that of its annual runrate dividend obligations, suggesting a degree of sustainability is present in the payout. Management is targeting a cash return of 50%-60% of adjusted net income to shares, though share buybacks will be a part of that equation. Shares currently yield more than 2.1%.
Management has made keeping its investment-grade credit rating a stated goal, and investors should expect a balanced mix of dividends and buybacks in coming years. Net debt stood at ~$870 million at the end of the third quarter of 2016, but its net-debt-to-adjusted EBITDA mark is quite manageable at ~1.2x, as of 2015. While we don’t expect International Flavors & Fragrances to develop a following for its income potential, we do believe its dividend payout is healthy (Dividend Cushion ratio of 1.7).
Understanding NextEra’s Dividend Cushion Ratio
Financial performance has been solid for US electric utility holding company NextEra (NEE) recently. Adjusted EPS has grown at a ~8% CAGR since 2004 and operating cash flows have strengthened, helping generate robust free cash flow of over $2 billion in each year from 2013-2015. The company recently updated its dividend policy, and it is now targeting a 65% payout ratio by 2018 and expects to grow its payout 12-14% per year through 2018. This represents an acceleration of growth from the 8.4% CAGR in the dividend since 2004. The firm has positioned itself well to capture the coming transition to renewable energy, and we can only expect continued growth in its dividend at this point; shares currently yield ~3.1%. Investors must be aware of NextEra’s massive debt load, however (see red bar in image below).
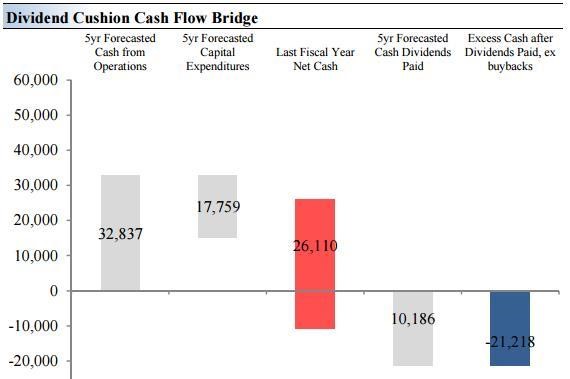
Image source: Valuentum
Most large public utility holding companies have raw, unadjusted cash-flow-derived Dividend Cushion ratios below 1, indicating that future expected free cash flows over the near term are completely absorbed by net debt obligations and future expected dividend payments (over a 5-year future forecast period). Utilities’ high dividend payout ratios (dividends paid per share divided by earnings per share) and elevated capital outlays–both of which prevent the buildup of cash on the balance sheet–coupled with the ballast of hefty debt obligations, which are higher on the capital structure than any equity concerns, prevent most utilities from receiving a healthy Dividend Cushion ratio, a proprietary Valuentum measure and a pure financial-statement based comprehensive assessment of the coverage of the dividend. NextEra’s Dividend Cushion ratio currently sits at 0.2 (divided the numerator, the left bar, by the denominator, the right bar).
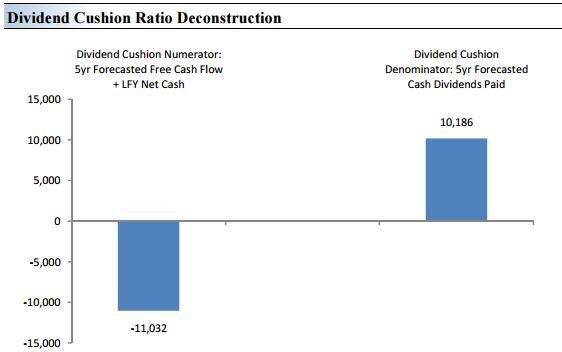
Image source: Valuentum
Utilities are among the most popular stocks for many income investors, a notion that has only intensified after years and years of loose monetary policy that has helped drive dividend yields of many utilities well past those of risk-free assets such as the 10-year Treasury bill. Utilities equities are generally considered “safer” investments relative to most other business models due in part to their fixed rate of returns through regulatory support and “monopolistic” characteristics that are common to their operations. All of this sounds great, but that doesn’t mean their dividends are iron-clad. If anything, we want income investors to be aware of the tangible dividend risks of the group.
Shown below: The Definition of the Dividend Cushion Ratio
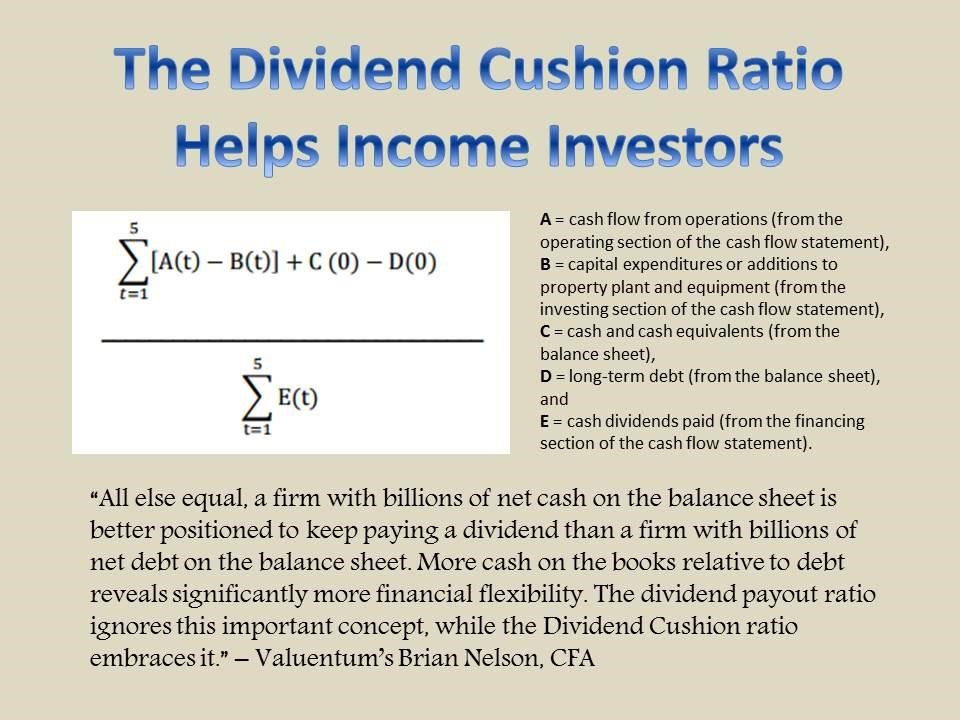
Image source: Valuentum
How utilities (XLU) perform as we move into a Trump administration and combat a new, rising interest rate environment will be interesting. Should the yields on risk-free instruments continue to expand, some income investors may switch to the risk-free option of Treasury bonds, pressuring utility equity prices in the process (utility stocks are widely used as income-oriented vehicles). However, potential tax cuts at the corporate level coupled with the timing of regulatory agreement updates could provide a period of elevated profit margins for some players in the sector. No matter what happens, we’ll be watching the industry in coming quarters.
Rockwell Collins: Emerging Dividend Growth Idea?
Rockwell Collins (COL) makes communications and aviation electronics for commercial and military customers worldwide, and as with many of its aerospace supply chain peers, Rockwell Collins has benefited from the multi-year commercial aerospace upswing. Though commercial airplane delivery growth has started to plateau a bit at the airframe makers, the backlog of unfulfilled deliveries at Boeing (BA) and Airbus (EADSY) remain several times that of their commercial revenue, speaking to ongoing visibility and a nice cushion to the dividends in the supply chain, including Rockwell Collins’. Rockwell Collins’ end market is still cyclical, however, and eventually orders and deliveries will slow.
We’re not expecting such a dynamic to play out in the near term though, as orders and deliveries for Rockwell Collins will continue to be driven by the currently massive backlogs of the likes of Boeing and Airbus, and we are expecting ongoing dividend expansion for Rockwell Collins. Free cash flow, as measured by cash flow from operations less all capital expenditures, offers sufficient coverage of the dividend, and we’re not too worried about leverage levels; debt-to-EBITDA stands at ~1.8x. Research and development, while necessary to drive future growth, can total as much as ~$1 billion per annum, hurting earnings, and free cash flow continues to go to share repurchases (perhaps making the dividend growth proposition a little less exciting). Total short and long-term debt stood at ~$2.1 billion at the end of fiscal 2016, a more than 17% increase from the beginning of the fiscal year. For fiscal 2016, the firm delivered free cash flow generation of ~$530 million, well in excess of its $172 million annual cash dividend obligations, however. There’s lots of room for growth!
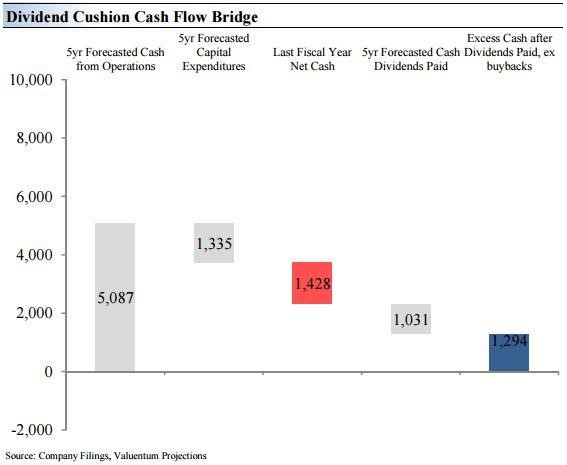
Image source: Valuentum
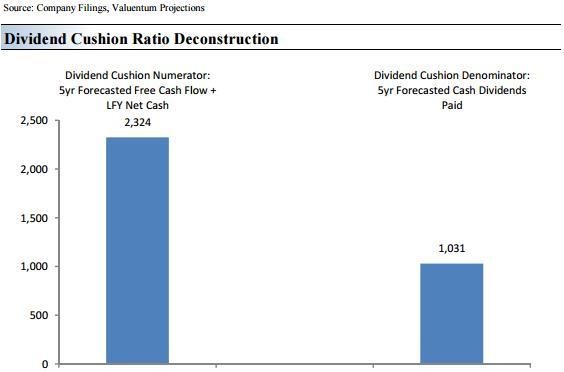
Image source: Valuentum
That said, Rockwell Collins’ dividend yield is just over 1.4% at recent price levels, making its strong Dividend Cushion ratio of 2.3 a bit less significant (almost by definition, the less sizable a company’s dividend obligations, the better it rates on the Dividend Cushion ratio, which is a comprehensive measure of dividend coverage). We generally prefer the dividend potential of larger players in the aerospace market that have better all-in yields, such as Boeing and Lockheed Martin (LMT) thanks to their strong business models and impressive free cash flow generation. While Rockwell Collins certainly lacks the scale of such behemoths and its recent acquisition agreement with B/E Aerospace will eat up capital, its free cash flow generating capacity makes it a strong candidate to continue growing its quarterly payout for years to come.
Stanley Black & Decker Has The Tools To Continue Dividend Growth
From a building products company with $2 billion in sales in 2000 to a diversified industrial entity with $11+ billion in revenue, it’s been an amazing journey for Stanley Black & Decker (SWK). The company is #1 in tools and storage, #1 in engineered fastening, and a top player in commercial electronic security services, and we can’t say enough about its established, global franchises.
But there is a bigger story to tell for income investors. Stanley Black & Decker has paid a dividend for ~140 consecutive years, and it has increased the payout in each of the past ~50 years, though its current yield is still a rather mundane at ~1.9%. Management points to a strong and growing dividend as a key reason to invest in its company, and frankly, the company’s track record speaks for itself.
A focus on cost containment and ongoing price/mix management will be par for the course to keep operating results and its dividend moving in the right direction. The company has been active with share buybacks as of late, but we think this speaks more of the cushion it has with respect to the dividend than anything else. A lot would have to go wrong for management to simply decide not to raise the payout in any given year, in light of its near half-century dividend growth track record. The company has a rather large net debt position of $3.4 billion, but average free cash flow generation of ~$740 million during the past five years has been solid (dividend obligations are ~$320 million per annum). We expect strong coverage to continue.
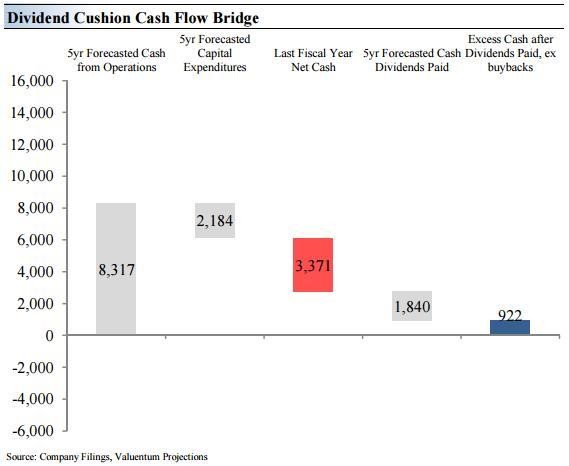
Image source: Valuentum
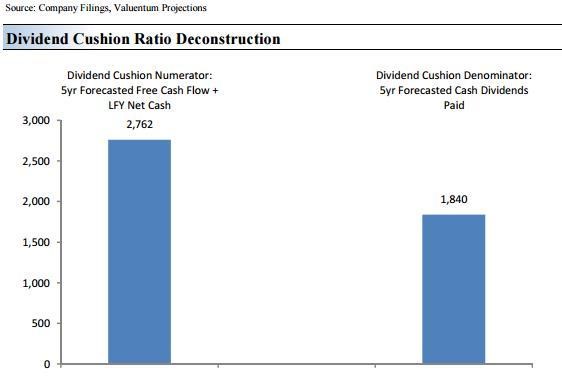
Image source: Valuentum
Oh My Ulta Salon – What A Run!
Who says being beautiful isn’t important? Well, if Ulta Salon’s (ULTA) recent performance is any indication, the market for beauty products may never be better than it is today. For those that don’t know about the company, Ulta Salon is the US’ largest beauty retailer and a key stop for those seeking fragrance, skin care, cosmetics, hair products and salon services. The company that prides itself on “All Things Beauty, All in One Place” is doing a lot of things right of late, and we point to a culture of personalized service and a top-performing rewards and e-commerce (apps) platform for the reasons why.

Image Source: Ulta Salon
Frankly, it’s hard not to like what Ulta Salon has accomplished, and its financial performance has been nothing short of fantastic in recent years. Net sales, comparable store sales and earnings per share have all exploded higher, and the massive $127 billion beauty market in the US offers Ulta Salon a long runway of growth. Its associates are engaged, and omni-channel opportunities remain robust. There may be little to derail the company, particularly as it ramps up awareness among consumers. Millennials, for one, are a large and growing segment, and teens tend to prefer Ulta Beauty. The seeds are planted among the young, and the company is poised to grow into a strong oak in years to come.
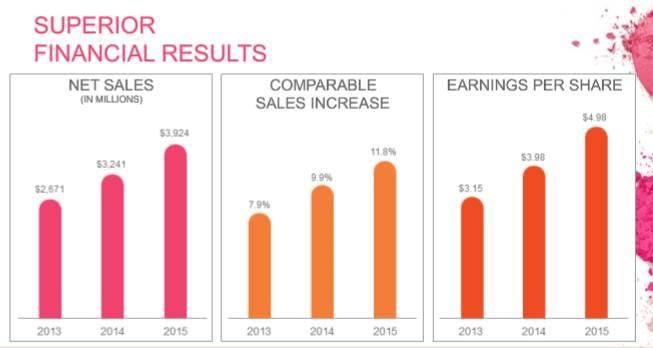
Image source: Ulta Salon
Ulta Salon’s third-quarter 2016 results, released December 1, were absolutely phenomenal. Revenue advanced 24% in the period thanks to a 17% gain in same-store sales, driven mostly by transaction growth, but average ticket was up nicely as well. Very few companies are growing same-store sales anywhere near that pace, and there is no better way to describe the showing as downright impressive. Diluted earnings per share advanced more than 24% in the period, and the company raised its bottom-line guidance for the year as a result, now calling for “earnings per share growth in the high twenties percentage range.” We really don’t think Ulta Salon could be doing better.
That said, such fantastic performance comes with a hefty price tag — its stock price. Ulta Salon is trading at nearly 32 times 2017 expected earnings (that’s 2017 earnings), meaning investors are paying up for such fantastic expansion prospects. The risk is that any slip up in same-store-sales performance in any given quarter could send the stock tumbling 5%, 10% or more. Ulta Salon has set itself a high bar, and even if it can’t meet expectations, the company is in a class by itself when it comes to growth potential.
Union Pacific Still Chugging Uphill
We like railroads for a number of reasons, including the oligopolistic nature of the industry, material barriers to entry, and pricing strength attributable to ownership of transportation routes. When looking at the railroad landscape, we’ve selected Union Pacific (UNP) to satisfy our exposure due to its ties to growth in Mexico and the US West Coast, its broad port access, and its scale and accompanying solid operating ratio (1 less operating margin). We’ve been huge fans of the trajectory of its efficiency initiatives and pricing power, but volume declines have been hurting a core component of our thesis of late, the performance of its operating ratio.
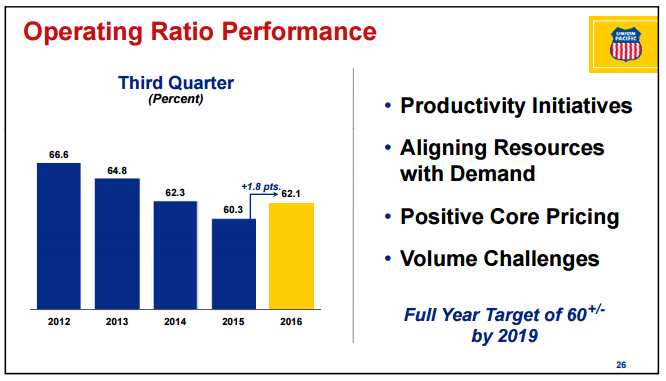
Image source: Union Pacific
It’s not entirely Union Pacific’s fault though. Operating ratios remain in flux across the railroad industry in 2016 as a result of some pretty steep volume weakness. In the third quarter of 2016, Union Pacific’s operating ratio added 1.8 points of unfavorable growth in its operating ratio (the lower the ratio, the better), resulting in a reported figure of 62.1%, and CSX (CSX) reported a similar move, but of lesser magnitude. Volatile energy resource pricing remains a headwind for volume trends across North American railroads, as suppressed crude oil and natural gas prices have not only reduced the amount of crude demanded to be shipped, but have also further impacted coal demand due to the more attractive pricing profile of natural gas for energy consumers.
Grain volumes varied across the continent, with US operators Union Pacific and CSX reporting a near record grain harvest and strong growth in agricultural product shipments while Canada Pacific (CP) reported a 15% decline in Canadian grain revenue due to a delayed grain harvest in its markets served. Intermodal volumes also varied across North America, as weakness in demand for consumer goods existed in both the US and its export markets, which pressured Union Pacific and CSX. Canadian Pacific also reported weak domestic intermodal demand, but its international intermodal revenue increased a healthy 5% in constant currency. Despite the recent pressures on volumes and its operating ratio, Best Ideas Newsletter portfolio holding Union Pacific remains our choice for exposure to the railroad industry. We continue to like its efficiency initiatives, including increasing average train speed (2% increase in the third quarter of 2016) and reducing terminal dwell time (2% decrease in the third quarter of 2016), and pricing power, even if recent volume weakness has been overwhelming.
The best operators in the railroad industry continue to set themselves apart via free cash flow generation, which goes hand in hand with strong operating ratios. Despite the unfavorable impact on Union Pacific’s operating ratio, the firm turned in solid free cash flow growth of more than 24% through the first nine months of 2016 from the comparable period in 2015, to nearly $2.9 billion. All in though, we’re not thrilled by the performance of Union Pacific since it was added to the Best Ideas Newsletter portfolio, but the railroad industry offers such a strong fundamental backdrop that we have a hard time removing the exposure. Rails are in many ways the “guts” of the American economy, and the ‘Trump phenomenon’ that we’re seeing in the markets as of late has reinvigorated shares. We’re not complaining.
Categories Member Articles