
S&P 500 companies are on pace to return a record amount of capital to shareholders via dividends and share repurchases, but what are the investment implications? Let’s take a look.
By Kris Rosemann
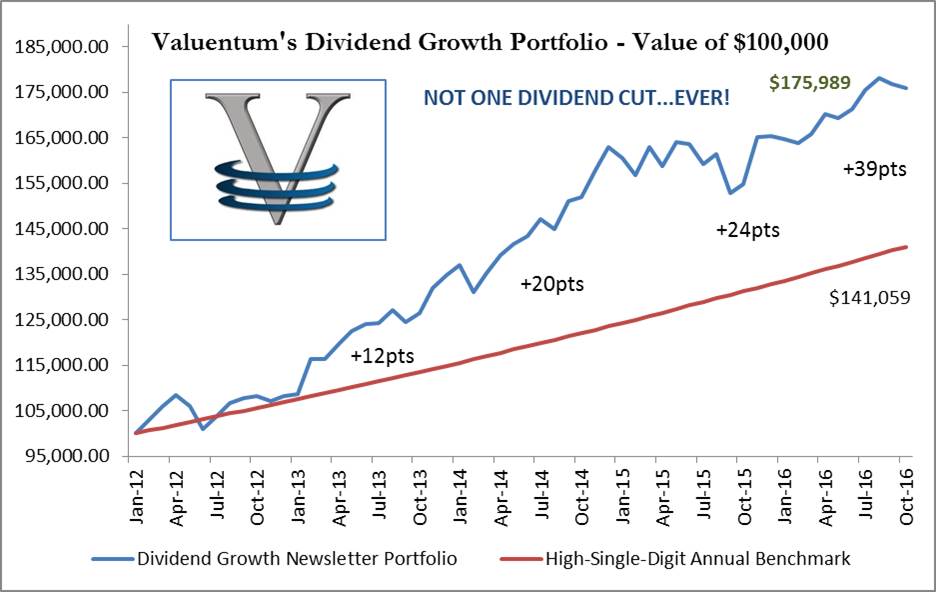
How can any company return too much cash to its shareholders, right? Well, let’s first start this discussion of recent capital allocation trends with some clarifying thoughts. We’re not against corporations returning excess capital to shareholders via dividends and buybacks (SPYB, PKW), provided they are value-generating moves. In many ways, we’re just as excited as the rest of the market about generating sustainable and growing income via strong dividend paying equities, as evidenced by the existence of the Dividend Growth Newsletter and the strong performance of its namesake portfolio since inception. However, much of the recent rush to return shareholder cash back to owners may not be as it seems, as it is in part being fueled by external capital market support and comparatively lower yields on fixed-income securities.
As of the second quarter of 2016, for example, the dividend yield on S&P 500 (SPY) companies was 2.07%, more than 40 basis points higher than the US 10-year Treasury yield (IEF) of 1.65%, a benchmark for the risk-free rate and the foundation upon which risk spreads are added to price debt instruments. Under these conditions, could some investors and financial advisors be choosing to replace the bond portion of their managed investment portfolios with riskier income or dividend growth stocks, in part or completely? The long-term implications have yet to be calculated precisely, but if this is the case, we posit that, in the event of a tipping point in the yield differential between dividend-paying stocks and yield instruments (where Treasury rates increase materially higher than the yields of most dividend-paying equities), asset flight away from some of the most overpriced dividend-paying entities may very well become a major theme under Federal Reserve contractionary monetary policy. The result? – lower stock prices.
With that said, let’s comment on some of the recent trends in the board rooms regarding capital allocation decisions taking place across the broader market and specifically with S&P 500 companies. Total payouts to shareholders, which include dividends and buybacks, are approaching an all-time high in 2016 as the measure is on track to reach $1 trillion this year, according to Barclays. The mix for the year is expected to break down to an approximate 60/40 ratio in favor of share repurchases. What’s more, dividends paid per share reached an all-time high in the trailing twelve month period ending with the second quarter of 2016. The idea of total payouts to shareholders growing isn’t necessarily a bad thing in itself, but when considering surrounding circumstances, namely the potential asset allocation shift away from fixed-income into dividend-paying equities, the trend becomes a bit more concerning.
The dividend payout ratio (dividends per share divided by earnings per share) of S&P 500 companies in the twelve month period ending in the second quarter of 2016 reached 39.5%, a multiple percentage point increase on a year-over-year basis and the index’s highest dividend payout ratio since the third quarter of 2009. Furthermore, the 6% growth in dividends-per-share for these companies in the twelve months ended June 30, 2016, does not correlate favorably with the index’s earnings-per-share falling for the fifth consecutive quarter in the second quarter of 2016. In addition to the aggregate payout ratio being elevated compared to traditional measures, 42 individual companies have payout ratios exceeding 100% over the same measurement period. Of those 42 firms, 20 came from the real estate sector (REITs whose dividend health is dependent on access to capital markets), 4 from the energy sector, and 3 from both the materials and information technology sectors. Could management teams be stretching too far to please?
A collective dividend payout ratio of ~40% is not all that concerning for an established company, as many in the S&P 500 are, but some red flags come along with total shareholder distributions (buybacks and dividends) taking up 120%+ of aggregate earnings in the S&P 500 in the twelve month period ending with the second quarter of 2016. For one, this marks the second-highest level on a trailing twelve month basis since the Financial Crisis, though with little consolation we mention the first quarter of this year was the only higher mark. Interestingly, when total payouts (dividends + buybacks) of 100%+ reported earnings are breached, the ensuing years aren’t all that great for equity prices. For example, in the previous three cases that this happened, it was followed by the Financial Crisis (2009-2010), the dot-com bust (2003-2004), and the recession of the early 1990s. Incredibly, total shareholder distributions have now exceeded aggregate earnings on a trailing twelve month basis in each quarter since the second quarter of 2015 (source: S&P, Haver, Barclays).
So where are firms getting all of this cash to return to shareholders if it’s not coming from earnings and/or internally-generated cash flows? Well, a growing number of companies are raising debt, in many cases, only to turn around and hand it right to shareholders. In fact, the S&P 500 has added roughly $1 trillion in debt during the past three years, and a large portion of that has been spent on dividends and buybacks. When one traditionally thinks of reasons for a business raising capital, uses such as growth projects, maintenance, and other tangible investments come to mind, not capital structure transformations or one-time distributions. Most peculiar, however, is that buybacks (a way to magnify leverage, especially if debt-funded) could arguably not come at a more inopportune time for shareholders. According to FactSet, the forward price-to-earnings ratio on S&P 500 companies stands at ~16.4 times, at the time of this writing, higher than both its 5-year and 10-year averages. We recognize the intricacies of tax- and interest-efficient corporate strategies that employ the use of issuing new debt, but buying back arguably significantly overpriced stock in large quantities is value-destructive to owners.
Please see our discussion of share buybacks, part of our Financial Analysis 501 series here >> /20131028_1
In light of recent sluggish global economic growth trends, there is also strong case that the increase in total shareholder payouts by S&P 500 companies may be a function of diminished expected returns on future potential capital investments, in addition to appeasing the increased demand for dividend income by equity investors. What the extremely elevated level of total cash returns to owners relative to earnings might imply for the pace of future global economic growth may suggest tough times to come, if the best course of action is simply to give shareholders their money back. Some of the core holdings in the Dividend Growth Newsletter portfolio have been among the biggest returners of capital to shareholders. Among the top spenders on dividends in the twelve month period ending June 30, for example, were Apple (AAPL), Microsoft (MSFT), and Procter & Gamble (PG). Unlike entities that may be overpaying for their own stock, however, Apple is underpriced (buying back stock is a good thing in this case), Microsoft reasonably priced (a value-neutral dynamic), while Procter & Gamble continues works to finalize its brand transformation (buybacks continue to be assessed).
Why is this conversation important? Well, if or when the yield spread between dividend-paying equities and fixed income vehicles closes considerably (or inverts), a flight to higher-yielding fixed income instruments may take place, pressuring the equity prices of dividend-paying stocks (an asset flight dynamic). Second, under such conditions, borrowing costs will have risen, and access to capital will become increasingly more difficult, meaning that padding total shareholder payouts with external debt capital will become more challenging (lower dividend growth or more dividend cuts). It is for this very reason that we continue to prefer dividend payers whose payouts are funded by internal cash flows, as measured by cash flow from operations less all capital spending. In particular, we continue to witness distribution cuts across the MLP (AMLP) universe, the latest of which are Stonemor Partners (STON) and Martin Midstream (MMLP). Other MLPs such as Memorial Production (MEMP), EV Energy (EVEP) and Midcoast Energy (MEP) have faced considerable selling pressure.
Please don’t get us wrong. We still very much like many dividend-paying entities, provided the entities are undervalued relative to our estimate of their intrinsic value (or in the ballpark under today’s frothy market conditions) and that they can cover their future cash dividend payouts with internally-generated free cash flow (CFO less all capex), bolstered by a balance sheet that is overflowing with excess net cash (total cash less total debt on the balance sheet). Remember – not all dividends/distributions are created equal, and the sobering S&P 500 total payout data, revealed above, is yet more evidence of the use of external capital by executive teams to pad cash returns to shareholders. We continue to lean heavily on the forward-looking, cash-flow based Dividend Cushion ratio in our dividend analysis, and it continues to highlight dividend disappointments far in advance of impending cuts. Its most recent highlights, for example, included warning about the cuts in the payouts of Oceaneering (OII), Stonemor, and Noble Energy (NE).
Be sure to continue monitoring the Dividend Cushion ratios of the holdings in your own portfolio! If this may be our only feature you use, it alone could very well pay for itself, hundreds of times over. Just look at what happened to Stonemor, an entity with a very poor Dividend Cushion ratio, and its unitholders of late. Not only have unit prices of the MLP collapsed but investors that are still holding on are now stuck with reduced income—a double whammy. We hope you enjoy this November edition of the Dividend Growth Newsletter!
The November edition of the Dividend Growth Newsletter will be released November 1.