
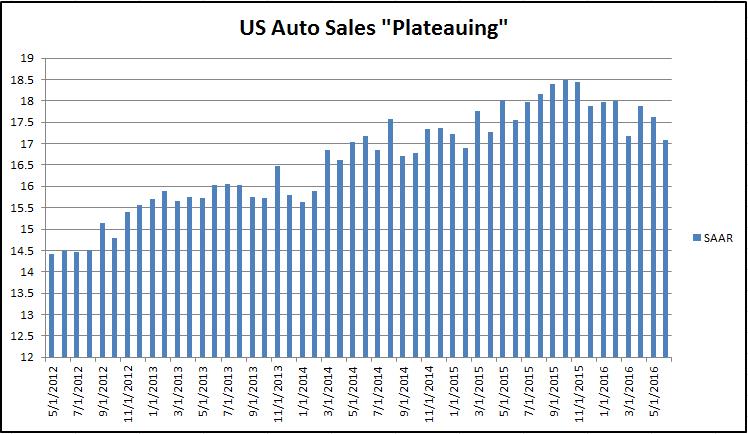
Source: YCharts
The fates of major US automakers General Motors and Ford remain as tethered as ever, but we remain in awe at how punitive “this” frothy market is on their respective valuations. For one, GM is trading at 5 times forward adjusted earnings and boasts a near-5% dividend yield!
By Kris Rosemann
The market has been very kind to some, but perhaps overly punitive to others.
While dividend-rich consumer staples giants continue to garner the favor of investors, “A Kleenex? Consumer Staples Trading At Nosebleed Levels (August 2016),” the ‘Detroit Three’ — Ford (F), General Motors (GM), and Chrysler (FCAU) — have all trailed the S&P 500 Index (SPY) return thus far in 2016 due to a variety of factors. Entities like Colgate-Palmolive (CL), for example, are trading at nearly 30 times current-year adjusted earnings, while General Motors, which has come a long way since the doldrums of the Great Recession, is trading at roughly 5 times forward earnings with a near-5% dividend yield to boot, twice that of most with lengthy dividend growth track records. How can the market be this inefficient? One possible reason: near-term news flow as it relates to the “business environment” from the auto industry has not been kind.
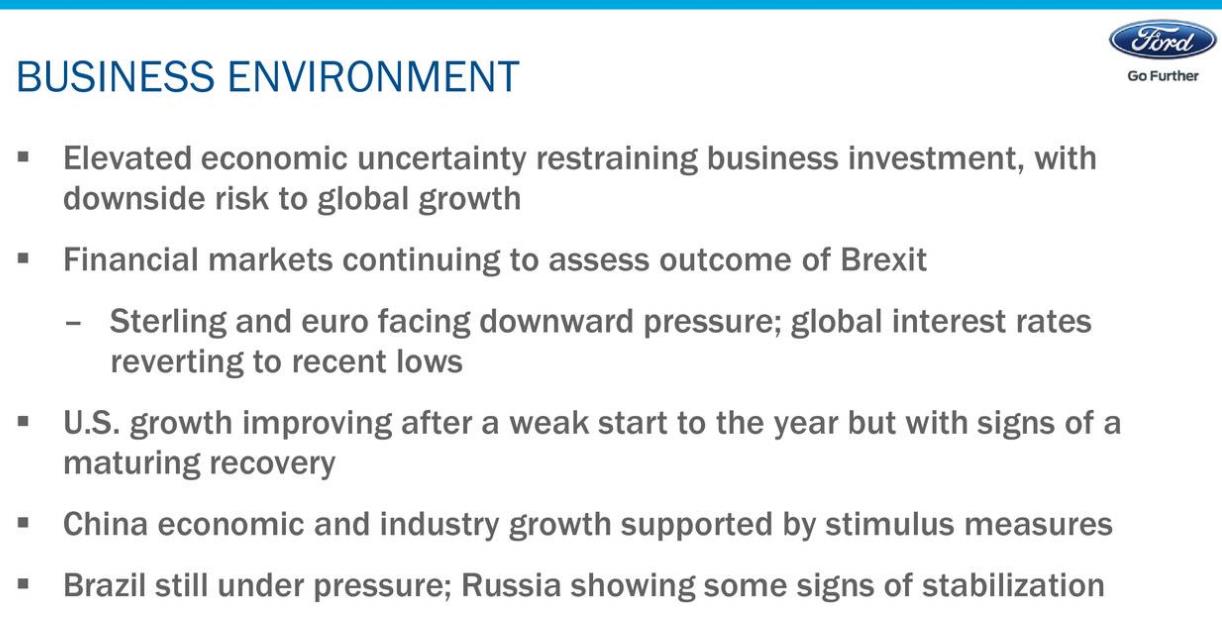
Image Source: Ford, July 28, 2016
There are a few dynamics worth emphasizing. Heightened competition and general economic uncertainty in China, Brexit concerns, operating-margin pressure as a result of incentive/promotional spending, difficult comps from a strong 2015, and the uncertainty surrounding the US Presidential election and the policy changes it could bring with it have all weighed on or are expected to weigh on the auto industry at one point or another in 2016. Ford’s second-quarter report, released July 28, in which it warned that the US auto industry is “plateauing” into the second half of 2016, certainly hasn’t helped matters, and US auto sales in the month of July reinforced the concerns of many. Ford’s July US sales, for example, dropped 2.8%, while GM’s fell 1.9%. Perhaps most troubling in the month was the unexpected 1% decline in Ford’s pickup truck sales, which had been one of the firm’s strong points as of late with its recent release of an all-new aluminum model of the F-150.
“If you look at the market factors, you can see that they were down on a net basis driven by the incentives and essentially what we’re seeing is over time and particularly as the US industry has started to plateau and we’re starting to get to a more mature part of the economic cycle in the US, we’ve seen sort of a very gradual rising – very modestly rising level of incentives for the industry and we have been increasing along with that.” – CFO Robert Shanks, Ford’s second-quarter conference call
If cautious commentary isn’t enough to keep auto investors on edge, the potential implications of the 2016 election cycle may weigh on the US auto sector more so than any other sector, in our view, and uncertainty is the only certainty. Implications of the Trans-Pacific Partnership and its potential ratification remain uncertain, as do Presidential-hopeful Donald Trump’s plan to impose tariffs on non-domestic auto and auto parts manufacturers. The future health of labor unions in the automaker industry could also lie in the balance of the election with the United Auto Workers endorsing Democratic candidate Hillary Clinton. The same can be said for the current electric vehicle (EV) tax credit. A President Trump might let the current $7,500 EV “tax credit go extinct,” which could reverberate through Tesla’s (TSLA) operations and other operators tied to that market. Tesla continues to lose money hand over fist (~$575 million through the first six months of 2016), even as EV tax credits are a part of its operations.
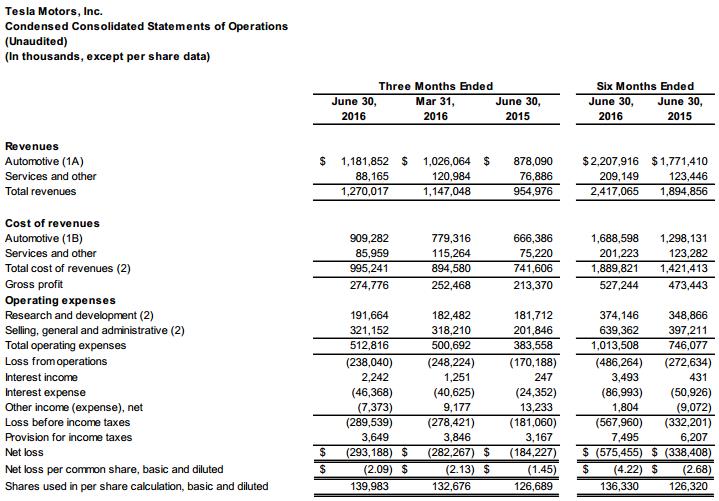
Image Source: Tesla’s second-quarter 2016 update, August 3
Many investors may not want to include any portion of the auto market as exposure in their respective portfolios, and they may have good reason. If Tesla’s massive losses aren’t enough, Ford’s aforementioned second-quarter report was full of disappointments. The auto giant reported solid revenue growth of more than 5% on a year-over-year basis but missed consensus estimates on the bottom line as diluted earnings per share fell more than 9%. Contracting operating margins in each of its regions except Europe were a key source of profit pressure. What’s more, Ford’s outlook was the most concerning aspect of its earnings report, too. Lower demand in the US retail auto market compared to 2015 is expected in the back half of the year, and global pressures such as Brexit could impact sales in Europe.
With the broader US stock market rallying considerably since the March 2009 panic bottom and that economic data has been robust through most of this run, many are betting that an inevitable turn in the cycle is nigh. Skeptics are saying: why own a cyclical and operationally-leveraged automaker like Ford so late into the economic recovery? Operating fundamentals aren’t necessarily moving in the right direction anymore either. Ford’s management expects costs to increase in the third quarter of 2016 as it launches the Super Duty line of pickup trucks, and additional bottom-line pressure is anticipated due to increased incentive spending. Profit margins in North America are worth watching, especially as Ford indicated it expects even further pressure on the US auto retail sector in 2017. The company has insisted that it is committed to achieving its full-year guidance, but warned that it is “facing risks to achieving that.”
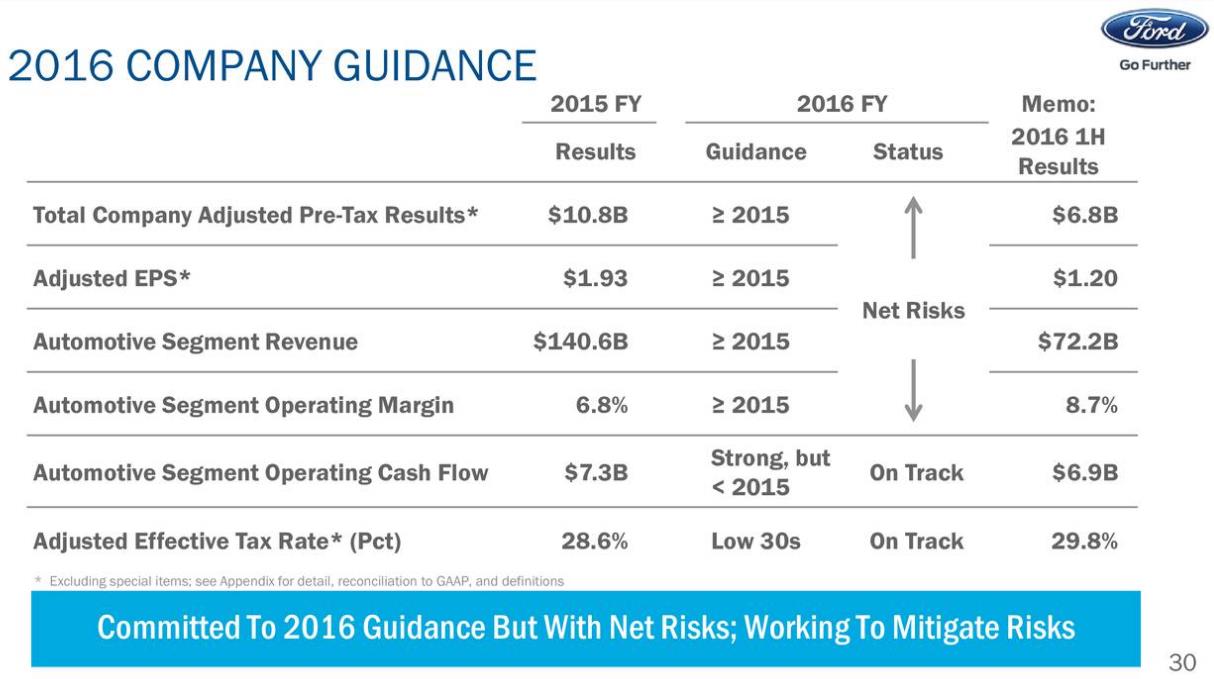
Image Source: Ford
General Motors can be viewed as a slightly more-efficient operator than Ford on the basis that its profit margin in North America is nearly a full percentage point higher than Ford’s. In fact, during the second quarter of 2016, GM reported post-bankruptcy records in operating margin in North America (12.1% compared to 11.3% at Ford), as well as globally (9.3%). This strong margin performance, coupled with post-bankruptcy record net revenue of $42.4 billion in the quarter, led to a post-bankruptcy quarterly record in adjusted EBIT, which grew 37% from the year-ago period to $3.9 billion. Such strong operational efficiency (and corresponding leverage) allowed GM to easily beat consensus estimates on the bottom line during the period, despite relatively flat sales, and led management to increase its full-year earnings per share guidance. GM now expects 2016 diluted-adjusted earnings per share to be in a range of $5.50-$6.00, up from previous guidance of $5.25-$5.75.
Importantly, we note that through the first half of 2016, GM generated GAAP earnings per share north of $3, so this adjusted bottom-line target is not unjustifiably augmented by non-GAAP massaging. Further, GM’s net automotive net cash stood at $12.3 billion (positive $12.3 billion) at the end of the second quarter (cash and cash equivalents and marketable securities less automotive debt, short and long-term). Annualizing automotive net cash flow from operations and adjusted automotive free cash flow suggests GM may pull in $10 billion and $6.4 billion, respectively, for 2016, the latter well in excess of annualized cash dividend obligations of ~$2.4 billion (it paid ~$1.19 billion through the first six months of 2016). GM’s Dividend Cushion ratio stands at a very solid 2.3.
Strong retail sales in the US and record sales in China were core drivers in GM’s exceptional second quarter, but the firm felt the same pressure as its peers in the month of July in the US as vehicle sales fell 1.9% on a year-over-year basis in the month. Though the concerning sales numbers in July echoed the sentiment in Ford’s warning for the back half of 2016 and into 2017, GM is working to improve its profit margin by reducing the number of lower-margin fleet sales. GM reports relatively better North American profitability than Ford, but the firm is still tied to the same top-line drivers and geopolitical pressures as Ford and other rivals, of course.
Cyclicality and capital-intensity are primary operating risks, but we’ve also outlined our concerns on the broader auto loan market recently, “Sharp Curves Ahead for US Auto Market? (July 2016)” specifically with respect to lenders Ally Financial (ALLY), Santander Consumer (SC), Credit Acceptance Corp (CACC). GM Financial remains GM’s global captive finance arm and offers retail automobile finance programs across both the prime and sub-prime lending spectrum. Average debt outstanding at GM Financial has more than doubled since 2013, a concern of ours, but investment-grade marks by the credit rating agencies offer a nice backstop to any trouble in the lending markets it may encounter during tough economic times. Though GM’s loan book continues to expand, it has learned its lesson from its difficulties during the Financial Crisis, in our view.
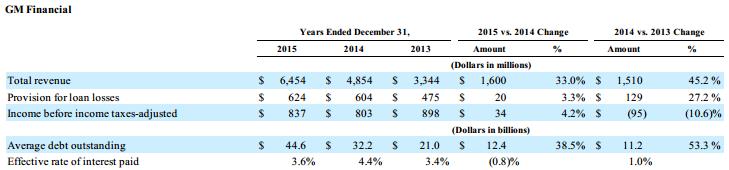
Image Source: GM 2015 10-K, page 34
GM is leaner now than it was pre-bankruptcy, and while it retains financial risk with GM Financial and holds an underfunded US pension plan of ~$10.4 billion, the company is on track yet again for another solid year of auto operating cash flow generation and free cash flow generation. Whether applying a GAAP or non-GAAP approach, GM is trading at an incredibly attractive forward P/E ratio; after raising its full year adjusted-diluted earnings per share guidance to $5.50-$6.00, the firm is now trading at 5+ times full year 2016 earnings per share guidance. We currently value shares at $43 each (the stock is trading just over $30 at the time of this writing), though upside to our fair value estimate is a very real possibility. The kicker is GM’s near-5% dividend yield, which remains easily covered by the company’s GAAP annualized free cash flow. Average free cash flow generation during the past three years (2013-2015) of ~$4 billion is far in excess of GM’s yearly run-rate cash dividend obligations of ~$2.24 billion (or 2015’s mark).
We’ve made some money in Ford in the Best Ideas Newsletter in the past, but GM’s investment opportunity is looking more and more interesting as investors overlook its higher yield and nice valuation for lower-yielding and higher-P/E consumer staples equities. GM certainly has a checkered past, of course, and while we can’t possibly state that the current level of dividend payments are completely safe over the long term due to its cyclical and capital-intensive business model, which magnifies pain during economic downturns, we’re not seeing any immediate threats to the payout in the near term (its second quarter was solid). In fact, its financials look surprisingly good. As with Ford, GM offers investors growth opportunities including a nice position in China, and the automaker has recently returned to profitability in Europe. The second quarter of 2016 marked the first profitable quarter for the firm in the region since 2011, and management remains committed to its profit target in Europe despite the adverse impact Brexit could have on its operations. We’re waiting for a technical breakout, but shares may be attractive to some investors, provided they are comfortable with the risks associated with such a cyclical automaker.
How far GM has come from the depths of bankruptcy, would you say?
Auto Manufacturers: F, GM, HMC, HOG, TM, TSLA
Related tickers: VLKAY, NSANY, RACE