
Teva Pharmaceutical has been a key source of outperformance for the Best Ideas Newsletter portfolio since its addition in mid-2013, with its return excluding dividends currently at ~50%. We continue to think the generic pharma space offers significant opportunities for participants, and we like Teva’s global market position. We’re particularly big fans of its ‘first-to-file’ position in the US generics market, and we like its efforts to protect specialty drug Copaxone as the world’s leading treatment of multiple sclerosis.
In the third quarter of 2015, foreign exchange rates took a slight toll on Teva’s reported revenue, which fell 5% from the year-ago period to $4.8 billion; on a constant currency basis, revenue increased 3%. Non-GAAP operating income and non-GAAP earnings per share both advanced 2% in the quarter to $1.6 billion and $1.35, respectively. Margin improvement came from decreased sales and marketing expenses, which were partially offset by increased general expenses and research and development spending.
Teva has labeled the third quarter of 2015 as a transformative period, as it focused the majority of its efforts on the completion of a number of acquisitions, including the $40.5 billion acquisition of Actavis Generics, previously a part of Allergan (AGN), a deal that will expand the firm’s commercial and research and development capabilities and geographic presence. Its generics segment has been firing on all cylinders with respect to profitability; the segment’s profit margin has advanced more than 12 percentage points since 2013. This should only improve over time following the closing of the Actavis deal expected in the first quarter of 2016.
The firm’s specialty medicines segment performed well on an organic basis in the third quarter of 2015, as revenue grew 5% when excluding the impact of foreign exchange rates. Teva’s blockbuster drug Copaxone reported record quarterly sales in the US. Specialty medicines profitability grew 2% in the quarter, mostly due to reduced sales and marketing expenses. The company has a diverse specialty pipeline from early stage development through the registration phase that will continue to drive growth in the segment for years to come. A snapshot of the pipeline as of the end of the third quarter of 2015 can be seen below.
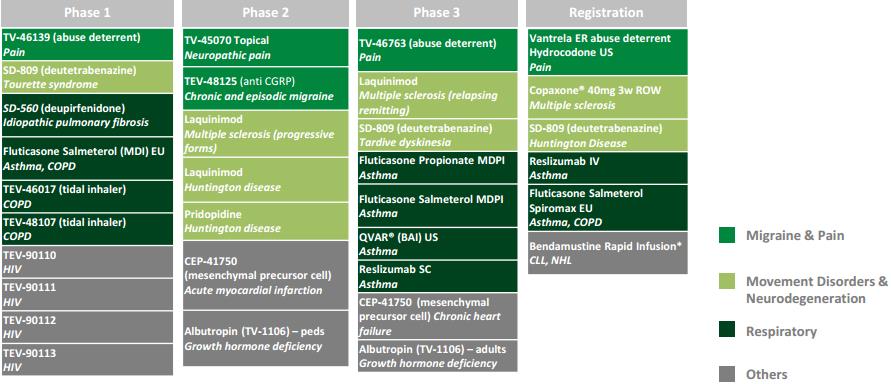
Image source: Teva quarterly presentation
Strong bottom-line performance throughout its business led Teva’s management to raise its full-year 2015 guidance yet again; the firm has raised its guidance after each quarter in 2015. The generics pharma giant is now expecting earnings per share to be in a range of $5.40-$5.45, up from previous guidance of $5.15-$5.40. All in, we think there remains significant opportunity in Teva’s existing pipeline, as well as the acquisition of Actavis. The upside of our fair value range suggests shares could easily reach the upper $70s.
Union Pacific remains our favorite railroad idea on a fundamental basis, and its shares have provided just over an 11% return since addition to the Best Ideas Newsletter portfolio in mid-2013, excluding dividends received. We expect the firm’s operating ratio (a unique railroad term measured as one less its operating margin) to be among the best in the railroad industry by the end of this decade, and we like its exposure to growth in Mexico as well as future export expansion on the West Coast. Though less so than several of its East Coast peers, the railroad is still levered to coal, which has been a source of weakness in the company’s recent performance as demand for variants of the commodity has declined significantly.
Total operating revenue for Union Pacific in the third quarter of 2015 fell 10% from the year-ago period, as volume declined 6% and offset core pricing gains. Coal, industrial products, and intermodal volumes all declined at a double-digit pace in the period. This pushed operating income down 5% and diluted earnings per share 2% lower, despite the company setting an all-time quarterly record for operating ratio. At 60.3%, Union Pacific’s operating ratio improved 2 percentage points on a year-over-year basis and is a 1.1 percentage point improvement over the previous quarterly record, set in the fourth quarter of 2014. Lower fuel costs were the main driver and accounted for 1.5 percentage points of improvement. The company paid 40% less on average for diesel fuel in the quarter, compared to the third quarter of 2014.
Looking ahead to the rest of 2015 and into the next year, Union Pacific continues to face uncertainties. Volatile energy prices, the ever-fickle consumer economy, unpredictable grain markets, and the strengthening US dollar as it relates to export growth will all play a part in the demand for the firm’s railroad operations. Nevertheless, the company’s continued improvement in its operating ratio (the lower the better) is a solid indicator of its ability to drive profits, and it will help to mitigate any pressure the firm may receive on its top line, as was evident in the third quarter of 2015. Union Pacific remains our favorite railroad operator.
Michael Kors is one of the more recent additions to the Best Ideas Newsletter portfolio. We added the global luxury lifestyle brand after the sharp drop in the markets in late August 2015 at what we believe to be a deep discount to its intrinsic value. Thus far, shares have provided a modest return, a good portion of which has come after the company’s most recent quarterly report. We’re hoping that a nice technical break out of the downtrend will result in a large jump to initiate price-to-fair value convergence.
In the second quarter of its fiscal-year 2016, ended September 26, Michael Kors reported strong top-line growth across all of its geographical segments. Total revenue grew nearly 7% as reported to $1.13 billion, good for over 12% growth on a constant-currency basis from the year-ago period. Both retail sales and wholesale sales advanced 7.5% or more in the quarter, while licensing revenue fell. When excluding the impact of foreign exchange rates, the company increased sales in its Americas segment by 5.6%, and the constant-currency growth rates of its Europe and Japan segments were much greater at 20.6% and 60.7% on a year-over-year basis, respectively.
However, comparable-store sales fell 8.5% in the fiscal second quarter, or a decrease of 3.4% on a constant currency basis. The impressive top-line growth in the period was driven by store expansion; Michael Kors’ store count increased by 215 stores from the second quarter of fiscal 2015. The jump in store count, among other investments, led to increased operating costs, as the firm realized nearly a 5 percentage point decrease in operating income margin. Decreasing gross margin played a role in the falling operating income as well, and operating income fell 10.6% from the year-ago period. Net income dropped 6.7%, while earnings per share were relatively flat due to decreased share count.
Looking ahead to the rest of fiscal 2016, Michael Kors expects to continue investing in digital flagships, corporate talent, new stores, shop-in-shops, infrastructure and distribution. This will lead to an increase of 200-220 basis points in operating expenses as a percentage of total revenue. Comparable-store sales are anticipated to fall by mid-single digits on a reported basis and low-single digits on a constant currency basis. Diluted earnings per share are expected to be in a range between $4.38-4.42 for the full fiscal year, roughly 10 times current-year earnings.
All things considered, we think the disparity between top-line and bottom-line growth in the second quarter of fiscal 2016 is reflective of management’s initiatives to spread its brand as it increases store count. As the new stores mature in their respective markets, we expect comps to improve and operating leverage to take place. We will be watching both metrics closely moving forward, and until comparable store sales turn the corner, we can’t say for certain that Michael Kors isn’t a value trap. That’s why its weighting is a mere ~1% in the Best Ideas Newsletter portfolio. We still may add a bit, however.