
Note: Please expect the roll out of the new dividend report on valuentum.com/ to occur gradually, in conjuction with the standard industry update cycle.
Summary
Visa is one of the best companies in one of the best industries.
Not only is the firm “everywhere you want to be,” but its high-margin business model throws off a lot of cash.
Perhaps what we like best about Visa, however, is its dividend growth potential.
Let’s walk through why and uncover the drivers behind its strong Dividend Cushion ratio.
It’s hard to find anything wrong with Visa’s (V) business model. The company offers a secure, payment network that is accepted virtually everywhere in the United States. The firm makes money every time a Visa user swipes his or her debit or credit card. Aside from traditional card companies, the only real competition Visa faces, in our view, is cash and mobile payment solutions, which V.me will address and has yet to take a stranglehold.
Visa benefits from two fantastic competitive advantages: a network effect and costly initial investment. The network effect is incredibly strong for Visa. As of its last update, the firm has more than 2 billion cards outstanding accepted by retailers across the world. The number is roughly double the number of Mastercards (MA) and over 20 times the amount of American Express (AXP) cards outstanding. This network effect took years, as well as billions of dollars to create — something that won’t easily be replicated by any new entrant.
Most importantly, Visa generates incredible operating margins in the 60% range, leading to large levels of free cash flow generation. The company continues to possess valuation upside and is one of the most shareholder-friendly companies in our coverage universe. But what is sometimes overlooked at the company is its fantastic dividend growth potential.
Note: Visa’s dividend yield is below average, offering a 0.7% annual payout at recent price levels. We prefer yields above 3% and generally don’t include firms with yields below 2% in our dividend growth portfolio. Though Visa currently does not fill the bill for addition to the Dividend Growth Newsletter portfolio, we think income investors should be watching shares closely, and this article explains why.
New on Page 2: Dividend Strengths
Visa’s rock-solid fundamentals provide the ultimate base for its dividend health. We think the firm’s business model is one of the best in one of the strongest industries, and its Dividend Cushion ratio is among the highest in our coverage universe. The fact that the company does not issue credit cards like Discover (DFS) or American Express keeps it from taking on credit risk that would otherwise harm its dividend potential. Though it does not have a rich history of dividend growth, we like the growth trajectory we have seen in recent years.
New on Page 2: Dividend Weaknesses
Based on its Dividend Cushion ratio, Visa clearly has tremendous dividend growth potential. However, management continues to choose to allocate its capital towards investments into its business and share repurchases. Management’s willingness to increase the magnitude of its payout seems to be the largest obstacle preventing dividend growth, from our point of view. That could be changing, however. Just in the past week, Visa’s executive team raised the payout 17%.
Dividend Safety
We think the safety of Visa’s dividend is excellent. We measure the safety of the dividend in a unique but very straightforward fashion. As many know, earnings can fluctuate, so using the payout ratio in any given year has some limitations. Plus, companies can often encounter unforeseen charges, which makes earnings an even less-than-predictable measure of the safety of the dividend. We know that companies won’t cut the dividend just because earnings have declined or they had a restructuring charge that put them in the red for the quarter (year). As such, we think that assessing the cash flows of a business allows us to determine whether it has the capacity to continue paying dividends well into the future.
That has led us to develop the forward-looking Dividend Cushion™ ratio, which we make available on our website. The measure is a ratio that sums the existing net cash a company has on hand (on its balance sheet) plus its expected future free cash flows (cash flow from operations less capital expenditures) over the next five years and divides that sum by future expected cash dividends over the same time period. Basically, if the score is above 1, the company has the capacity to pay out its expected future dividends and the expected growth in them.
As income investors, however, we’d like to see a score much larger than 1 for a couple of reasons: 1) the higher the ratio, the more “cushion” the company has against unexpected earnings shortfalls, and 2) the higher the ratio, the greater capacity a dividend-payer has in boosting the dividend in the future. For Visa, this ratio is 7.6, revealing that on its current path the firm should be able to cover its future dividends and growth in them with net cash on hand and future free cash flow.
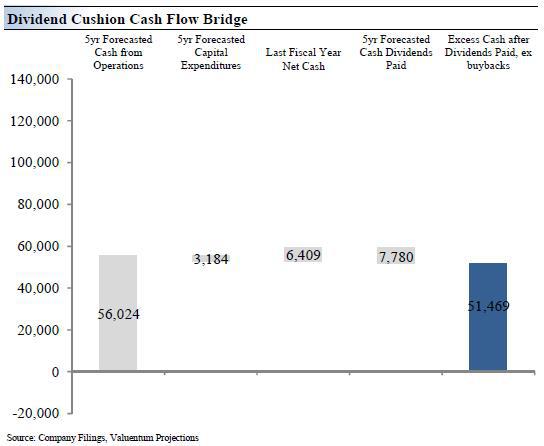
New on Page 2: Dividend Cushion Ratio Cash Flow Bridge
The Dividend Cushion Cash Flow Bridge, shown in the image below, illustrates the components of the Dividend Cushion ratio and highlights in detail the many drivers behind it. Visa’s Dividend Cushion Cash Flow Bridge reveals that the sum of the company’s 5-year cumulative free cash flow generation, as measured by cash flow from operations less all capital spending, plus its net cash/debt position on the balance sheet, as of the last fiscal year, is greater than the sum of the next 5 years of expected cash dividends paid.
Because the Dividend Cushion ratio is forward-looking and captures the trajectory of the company’s free cash flow generation and dividend growth, it reveals whether there will be a cash surplus or a cash shortfall at the end of the 5-year period, taking into consideration the leverage on the balance sheet, a key source of risk. On a fundamental basis, we believe companies that have a strong net cash position on the balance sheet and are generating a significant amount of free cash flow are better able to pay and grow their dividend over time.
Firms that are buried under a mountain of debt and do not sufficiently cover their dividend with free cash flow are more at risk of a dividend cut or a suspension of growth, all else equal, in our opinion. Generally speaking, the greater the “blue bar” to the right is in the positive, the more durable a company’s dividend, and the greater the “blue bar” to the right is in the negative, the less durable a company’s dividend.
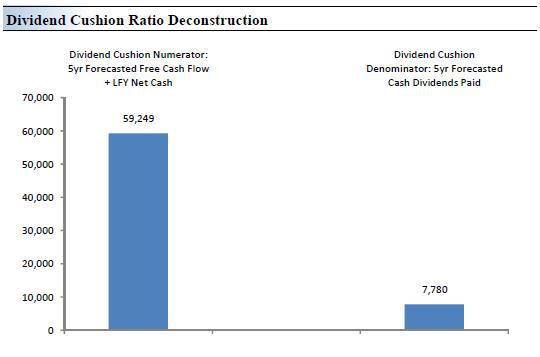
New on Page 2: Dividend Cushion Ratio Deconstruction
The Dividend Cushion Ratio Deconstruction, shown in the image below, reveals the numerator and denominator of the Dividend Cushion ratio. At the core, the larger the numerator, or the healthier a company’s balance sheet and future free cash flow generation, relative to the denominator, or a company’s cash dividend obligations, the more durable the dividend. In the context of the Dividend Cushion ratio, Visa’s numerator is larger than its denominator suggesting strong dividend coverage in the future. The Dividend Cushion Ratio Deconstruction image puts sources of free cash in the context of financial obligations next to expected cash dividend payments over the next 5 years on a side-by-side comparison. Because the Dividend Cushion ratio and many of its components are forward-looking, our dividend evaluation may change upon subsequent updates as future forecasts are altered to reflect new information.
Please note that to arrive at the Dividend Cushion score, divide the numerator by the denominator in the graph below. The difference between the numerator and denominator is the firm’s “total cumulative 5-year forecasted distributable excess cash after dividends paid, ex buybacks.”
Dividend Growth
Now on to the potential growth of Visa’s dividend. As we mentioned above, we think the larger the “cushion” the larger capacity the company has to raise the dividend. However, such dividend growth analysis is not complete until after considering management’s willingness to increase the dividend. To do so, we evaluate the company’s historical dividend track record. If there have been no dividend cuts in the past 10 years, the company has a nice dividend growth rate, and a solid Dividend Cushion ratio, we characterize its future potential dividend growth as excellent, which is the case for Visa.
Because capital preservation is also an important consideration to any income strategy, we use our estimate of the company’s fair value range to assess the risk associated with the potential for capital loss. In Visa’s case, we currently think shares are fairly valued, meaning the share price falls within our estimate of the fair value range, so the risk of capital loss is medium (our valuation analysis can be found by downloading the 16-page report on our website). If we thought the shares were undervalued, the risk of capital loss would be low.
Wrapping Things Up
All things considered, there’s a lot to like about Visa and its dividend growth potential. The company has a fantastic business model that generates high margins and throws off lots of free cash flow. It benefits from one of the strongest competitive advantages: the network effect. Its dividend growth potential may be its most promising attribute of all, however. With a Dividend Cushion ratio of more than 7, Visa can easily double or triple its dividend. The only holdup is management’s willingness to take the payout to competitive levels, which may be changing. Should management raise the payout in a big way, we think shares will react very positively. Shares currently yield less than 1% at the moment, so patience may be needed for income investors.