A prolonged period of low interest rates has driven income investors to dividend growth investing as a way to achieve retirement goals. Traditional dividend growth analysis has rested on evaluating a company’s dividend payout ratio and its track record of historical consecutive annual dividend increases. A supplement to these approaches, the forward-looking, cash-flow- based Dividend Cushion ratio maps a company’s future expected free cash flows to its future expected cash dividends paid (after considering balance sheet health) and has shown to be a superior indicator of both dividend growth (risk) and total return relative to other dividend growth analytical processes. The results in this paper showcase the outperformance of a select number of high-yielding equities with strong Dividend Cushion ratios relative to both S&P 500 firms and companies with decades of consecutive annual dividend increases. – Valuentum Securities
Download the white paper, “The Dividend Cushion Beats the Aristocrats,” .
With rumors swirling about what Apple (AAPL) might show off to the world at its September 9th event, excitement surrounding shares of its equity has again reached a fever pitch, only days after concerns about China pummeled shares. We think consumers are as thirsty for new, improved devices, as investors are enthused about the company’s valuation anomaly and the long-term dividend growth potential of its stock. From new iPhones to an improved Apple TV set top box to an iPad Pro to new accessories for the Apple Watch and another version of the iPad mini, Apple will likely turn heads in just a few short days.
But that’s just the tip of the iceberg. The company’s stock is as rock-solid as it gets, too. The iPhone giant’s cash flow from operations has advanced more than 45% through the first nine months of its fiscal year 2015, to a staggering $67.8 billion. To put this step-change in cash-flow generation into perspective, for all of the fiscal years of 2014, 2013 and 2012, respectively, the company generated $59.7 billion, $53.7 billion, and $50.9 billion. We’re starting to think our $70-$75 billion forecasts for cash from operations in fiscal 2015 and fiscal 2016 are too conservative. For one, if the existing pace of cash-flow growth is any indication, Apple will generate ~$85 billion in cash from operations during the current fiscal year and only shell out ~$10 billion in capital spending.
That’s ~$75 billion in traditional free cash flow in one year!
Since any valuation construct considers the net cash on the balance sheet as tangible, bird-in-the-hand wealth that the shareholder already owns, let’s get to numbers in this area. As of June 27, Apple held $202.8 billion in cash and marketable securities against a total debt load, consisting of short and long-term debt, of ~$49.9 billion, making for a net cash position of $152.9 billion. Let’s now deduct this $152.9 billion straight from Apple’s market capitalization of ~$639.2 billion, resulting in a “present value” estimate $486.3 billion. The way to interpret this $~486 billion number is rather straightforward within the valuation context.
If you believe Apple, on a present-value basis, can generate more than ~$486 billion in traditional free cash flow cumulatively over the rest of its corporate life (not in one year, but forever), then shares are cheap. If you think, however, that Apple will only operate at current cash-flow levels for about the next 6-7 years on the basis of its current run-rate of $75 billion in annual traditional free cash flow, not expanding or contracting, and then never generate another dollar in free cash flow again after the seventh year, you might say shares are fairly valued at present levels. If you believe that Apple’s cash flow generation prowess for the rest of its corporate life (i.e. cumulatively into perpetuity) will fall short of the ~$486 billion number, then you might view shares as expensive. This is one way of conceptualizing the balance sheet and free cash flow generation within the valuation context.
Our bet is that Apple will generate cumulative discounted free cash flow significantly greater than the ~$486 billion mark. The equity markets, in our view, are truncating Apple’s free cash flow stream after year 6 or 7, and by extension, are pricing in a doomsday scenario for Apple. Not only are the markets assuming the iPhone will eventually go the way of Blackberry’s (BBRY) namesake and Motorola’s (MSI) Moto RAZR, but that all of Apple’s products will vanish in time, including the iPad and anything else it has in the pipe, and that its ecosystem will collapse. This is what’s built into Apple’s stock, which trades at just ~8.7x consensus fiscal 2016 earnings, less net cash on the balance sheet. That’s nearly half of the multiple of the average stock in the S&P 500.
The story with Apple gets better though.
At Valuentum, our work is grounded in free-cash-flow based and balance-sheet analysis, not only with respect to equity valuation, but also with respect to assessing future dividend health. To understand how much Apple could increase its dividend, a look at its cash flow statement is telling. During the fiscal years of 2014 and 2013, for example, Apple paid out in cash as dividends $11.1 billion and $10.5 billion, respectively, and is on pace to pay out roughly ~$11.5 billion in fiscal 2015. Let’s go back to what Apple is on pace to generate in traditional free cash flow (cash flow from operations less capital spending) during the current fiscal year: ~$75 billion. That means, in terms of free cash flow generation for this fiscal year alone, Apple can cover its dividend payout ~6 times–depending on what the reported numbers end up being.
If this hasn’t caught your attention, it’s even better.
The $152.9 billion that Apple holds on its balance sheet as net cash is yet another backstop to its dividend payment as well. Said differently, should Apple’s traditional free cash flow in any given year ever come up short to the cash dividends paid, Apple would be able to tap into its balance sheet to pay a portion or all of the dividend. Not only can Apple cover its annual cash dividend with traditional free cash flow ~6 times, but the net cash on the balance sheet covers its annual cash dividend 13+ times. When we speak of dividend safety at Valuentum, this is what we’re talking about.
We apply this framework within the context of the Dividend Cushion™ ratio, which we publish for all firms within our coverage universe. The Dividend Cushion ratio takes the sum of company’s net cash on its balance sheet and the sum of the company’s future traditional free cash flow generation over the next five years, and divides that sum by the company’s future expected cash dividends paid and growth in them over the next 5 years. Our forecast for Apple’s dividend growth is between 15%-25% over the next five years, and the iPhone giant still registers a Dividend Cushion ratio of 5.
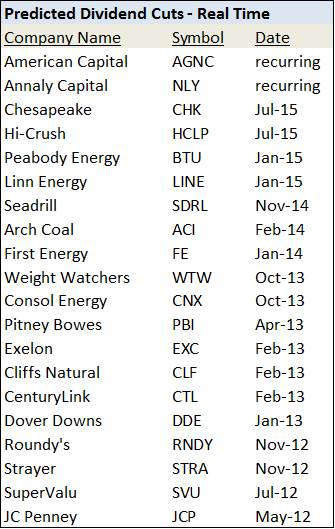
It’s now probably easy to see why Apple is one of Valuentum’s favorite ideas on the market today. Entities that have overleveraged balance sheets and that pay out all of their cash flow from operations as dividends to shareholders can’t possibly have safe dividends, in our view. Know the difference. The Dividend Cushion ratio is available for all companies in our coverage universe. Transocean (RIG) has been but the latest company the Dividend Cushion ratio had warned about before an impending cut or elimination.