
By Brian Nelson, CFA
We often receive questions about our methodology. For our new members, the Valuentum style has three distinct components: a discounted cash flow assessment (intrinsic value calculation), a relative valuation assessment, and a timeliness assessment. We’ll focus on the first pillar in this article.
The Valuentum process is grounded in financial statement analysis, where our analyst team derives the ValueCreation, ValueRisk, and ValueTrend ratings of a company. Together, these ratings provide a quantitative and objective assessment of the strength of a firm’s competitive advantages, or in Warren Buffet’s terminology, the firm’s economic moat.
To derive the ValueCreation rating of each company, the Valuentum team compares a company’s return on invested capital (ROIC) to its estimate of its firm-specific weighted average cost of capital (WACC) to assess whether the firm is creating economic profit for shareholders (ROIC less WACC equals economic profit). We derive a company-specific cost of equity (using a fundamental beta based on the expected uncertainty of key valuation drivers such as revenue and operating income) and a cost of debt (considering the firm’s capital structure and synthetic credit spread over the risk-free rate), culminating in our estimate of a company’s weighted average cost of capital (WACC). We don’t use a market price-derived beta, as we embrace reasonable market volatility, which provides investors with opportunities to buy attractive stocks at bargain-basement levels.
Most of the discount rates in our coverage universe are between 8% and 10%, though some high-risk airlines or commodity producers, for example, may garner much higher discount rates due to the volatility of their underlying business operations. Firms that have improving economic profit spreads over their respective cost of capital score highly on the ValueCreation and ValueTrend measures. Firms that have relatively stable returns over time score well with respect to our ValueRisk evaluation, which impacts the margin-of-safety assessment, or the fair value range. These three individual ratings—the ValueCreation, ValueTrend, and ValueRisk ratings—can be found on the front page of each company’s 16-page report under the ‘Investment Considerations’ section.
After evaluating historical trends, we then make full annual forecasts of each item on a company’s income statement and balance sheet to arrive at the company’s future free cash flows. Our near-term forecasts may not differ much from consensus, but we find that the application of the DCF, in general, uncovers a variety of mispricings that are frequently overlooked by investors focused more on quarterly performance. We then assess each company within our complete three-stage free cash flow to the firm (enterprise cash flow) valuation model, which generates an estimate of a company’s equity value per share based on its discounted future free cash flows and the company’s net balance sheet impact, including other adjustments to equity value (namely pension and OPEB adjustments).
The ValueRisk rating, which considers the underlying uncertainty of the capacity of the firm to continue to generate value for shareholders, sets the margin of safety bands around this fair value estimate. For firms that are trading below the lower bound of our margin of safety band, we consider these companies undervalued based on our DCF process. For firms that are trading above the higher bound of our margin of safety band, we consider these companies overvalued based on our DCF process. For firms that are trading within the fair value range, we consider them to be fairly valued. Though we provide a single fair value estimate for each company, readers should understand that — because all value is created in the future and the future is unpredictable — the fair value range (which is also provided) should be more appropriately used in practice. Value is a range of probable outcomes not a single point fair value estimate.
The model we apply to ascertain the cash-flow-derived fair value estimate of each company consists of three individual stages. The first stage is a 5-year discrete period (where all items on the financial statements are derived), the second stage fades incremental returns on invested capital at the end of the discrete period to a company’s cost of capital over time, and the final stage is a standard growing perpetuity function.
Within each company’s 16-page report (page 5 of each report), we show the value that each stage contributes to the calculation of a firm’s total intrinsic value. The more value generated during the first two stages, the less volatile one might expect a company’s fair value to be in future updates, while the more value that is generated in the perpetuity function (stage III), the more risky the valuation outcome and the more volatile the expected fair value. The ValueRisk rating captures the fundamental volatility of key inputs such as revenue and operating income in assessing future economic value, but the duration of a company’s future free cash flows sheds further light on the uncertainty of a company’s valuation profile.
For example, if you’re holding a stock where, let’s say, more than 70% of its value is generated in the “perp” (or beyond Year 20), the company has a lot to deliver upon to meet expectations embedded within the intrinsic valuation calculation. Generally speaking, the lower the percentage originating from the perpetuity, the lower the risk that the firm will not live up to long-term expectations. The higher the percentage generated from the perpetuity, the greater the risk that the firm will not live up to expectations.
Let’s examine recent earnings from 3 Internet giants. Let’s also include the percentage of the firm’s total intrinsic value that is generated from the perpetuity and a discussion about what this might mean regarding intrinsic-value uncertainty.
Reminder: You can always access the most up-to-date information in each company’s 16-page report, which reflects our current opinion on the firm.
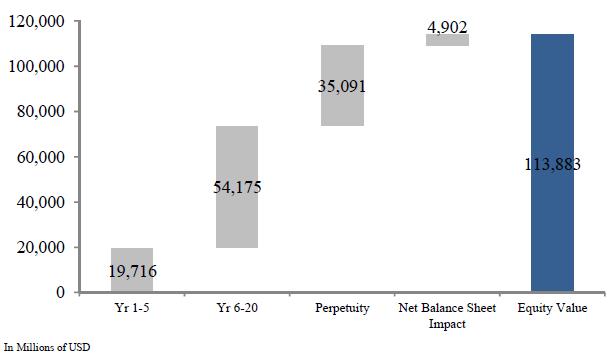
eBay (EBAY) *Best Ideas Portfolio Holding* (Perpetuity = 31% of intrinsic value)
eBay is a global commerce and payments company that uniquely benefits from a network effect in its auction business and a secular trend toward consumer online consumption in its payments business, PayPal. We think the firm may economically-split eBay and PayPal in a value-creating IPO in coming years, and we think patient investors will be rewarded greatly when this happens.
That said, we weren’t happy with management’s decision to repatriate foreign earnings, announced in its first-quarter results, resulting in an unnecessary and unexpected tax bill of $3 billion. To save from paying the tax bill, eBay could have issued new debt (like Apple) to fund repurchases and/or refill its cash coffers. In our view, the move is roughly value-neutral and can possibly be considered value-destructive if an international opportunity comes along, and eBay is unable to capitalize on it.
Our value-neutral calculation is as follows: if eBay buys a total of $5 billion worth of stock (the magnitude of its buyback program) or about 96 million shares at current prices, the company would generate roughly $3.4 billion in shareholder value [96m x (87-52)], approximating the $3 billion tax charge [shares repurchased x (fair value – stock price)]. Though we’re generally debt-averse, we think management could have issued new debt and generated the entire $3.4 billion of economic value in doing so, instead of repatriating profits and adding just $400 million in economic value, which inevitably has to be discounted as a result of lost international flexibility.
The unnecessary tax bill aside, eBay’s first-quarter results showed 14% top-line growth and 11% non-GAAP earnings expansion, adjusted for the tax charge. Total company enabled commerce volume (ECV) increased 24% in the first quarter to $58 billion, while mobile ECV advanced 70% to $11 billion representing 19% of the volume. PayPal’s net total payment volume grew 27% with Merchant Services volume up 32%, and we have no qualms with the firm’s rapid pace of expansion. The company reiterated its full-year revenue and adjusted earnings per share guidance, though its second-quarter outlook was slightly below consensus views. Shares remain very cheap, and though we’re not fans of management’s decision to pay taxes to move profits back to the US (just to buy back shares), we’re not budging with our position in the Best Ideas portfolio.
eBay’s valuation distribution is rather normal, with the majority of value generated during Stage II, as it should be. Roughly 31% of its value is generated in the perpetuity.
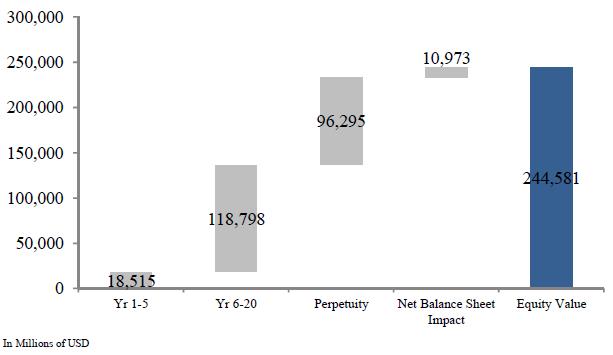
Facebook (FB) — VBI: 7 — FVE: $97 (Perpetuity = 39% of intrinsic value)
As global data coverage improves, the number of mobile monthly active users will continue to grow. Facebook looks well-positioned to seize upon this trend, and Facebook’s younger demographics are increasingly accessing its platform from mobile devices. We acknowledge that the likelihood of a single-stock bubble in Facebook is considerable. If the talk of Facebook possibly becoming the new Internet starts to expand across social media, the trajectory of its share price rise will be meteoric (whether it comes true or not) – remember, share prices are based on future expectations (not future reality – which will always be elusive). Facebook’s first-quarter results revealed fantastic revenue expansion, impressive operating-margin expansion, and solid earnings-per-share growth. The firm continues to execute nicely, which is a prerequisite for price-to-fair value convergence in almost every case. Our fair value estimate of Facebook is $97 per share. With shares trading just under $60 each at the time of this writing, pricing upside exists at the social networking giant.
As for Facebook’s valuation profile, the firm’s valuation is riskier than eBay’s but not nearly as risky as that of Twitter (TWTR), which we’ll see later. Nearly 40% of Facebook’s intrinsic value is generated by the perpetuity calculation.
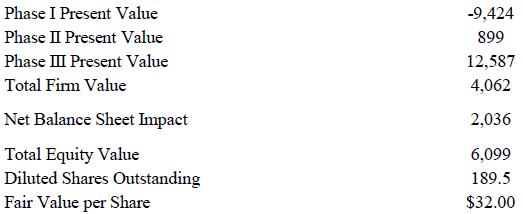
Twitter — VBI: 4 — FVE: $32 — (Perpetuity >100% of intrinsic value)
Twitter’s intrinsic value estimate completely depends on its ability to remain a going concern long into the future and generate gobs of cash flow decades from now (see how all of its value is generated in Phase III of the model below). The company’s risk profile is tremendous, and investors should expect a volatile valuation assessment with every new update, particularly as new information comes to light. Perhaps needless to say, Twitter’s quarterly performance is of little value to shareholders as all of the company’s intrinsic value depends on what the company will look like beyond Year 5. The company’s full-year outlook, which it released in its first-quarter results, came in lower than what shareholders had hoped. As we’ve stated previously, shares of Twitter can surge or tumble and the stock-price movement will largely remain within the probable range of fair value outcomes at this juncture. We think it’s wise to stay on the sidelines.
Wrapping It Up
The DCF offers far more information about a company than just a fair value estimate. From assessing the duration risk of future cash flows and more, the DCF is every investor’s most valuable tool. Members can always access the most recent information about a company in its corresponding 16-page report and/or dividend report. Or build their own DCF models here. We continue to hold eBay in the Best Ideas portfolio, as we keep an eye on Facebook and stay as far away from Twitter as possible. Our best ideas are always included in the Best Ideas portfolio and Dividend Growth portfolio.