
Just like a sell-side analyst isn’t required to reiterate his or her buy/sell/hold recommendations every day (despite immaterial week-to-week pricing changes), we don’t reiterate our Valuentum Buying Index ratings every day either. However, as with sell-side recommendations, our Valuentum Buying Index ratings still represent our current opinion.
It should be assumed that, if a firm’s report (one that’s dated September 2013, for example) states that the firm’s VBI rating is a 9, the company’s current VBI rating is a 9. Just like in the case of when a sell-side analyst issues a ‘Buy’ recommendation in September 2013, the sell-side analyst would still have a ‘Buy’ recommendation on the stock today (until the recommendation is changed).
This dynamic is the only way that our system is equivalent to that of the sell-side. Our VBI ratings are not buy, sell, or hold recommendations. Our best ideas are included in the portfolio of our Best Ideas Newsletter (page 8), while our best dividend growth ideas are included in the portfolio of our Dividend Growth Newsletter (page 5). Nothing on our website should be viewed as a solicitation to buy or sell any security.
The Valuentum Buying Index ratings across our coverage universe can be found here (a link that is permanently established on the left column of the website’s home page), and pasted below is a snapshot of the top rung of the current VBI distribution. Baidu (BIDU) has recently performed wonderfully, eBay (EBAY) has roughly doubled since it first registered a VBI of 10, AIG (AIG) has performed well, while Helen of Troy (HELE) and Tyson Foods (TSN) have also been excellent performers since originally registering ratings of 9 — the rating history of any operating firm can be found on page 16 of its respective report.
In this piece, let’s take a look at the third-quarter performance of a few newly-minted VBI ratings of 9: Deluxe (DLX), NASDAQ OMX (NDAQ), and USG (USG).
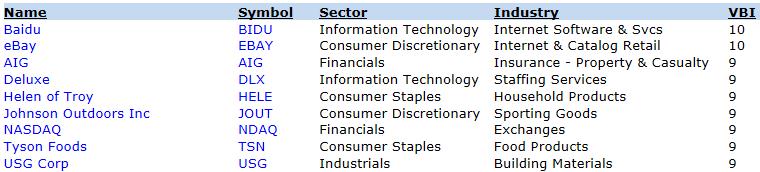
Image Source: Valuentum
Deluxe Converts 14% of Revenue to Free Cash Flow; Trades at Less Than 12 Times Earnings
Deluxe (DLX) is one of the top check producers in North America. It also provides small business solutions, including web services and search-engine marketing. Thursday morning, the firm posted third-quarter results that beat on both the top and bottom lines. Revenue advanced 5.2% thanks to strength in its ‘Small Business Services’ segment. Operating income jumped nearly 10%, while net income increased 13% and diluted earnings per share leapt at a similar pace.
For the full-year 2013, Deluxe tightened its revenue guidance and raised its adjusted diluted earnings per share range to $3.78-$3.85 (was $3.72-$3.82) and its operating cash flow target to $256-$262 million (was $250-$260 million). For full-year 2014, revenue is expected to advance at a 2%-4% pace, while diluted earnings-per-share is expected to jump 3%-6%.
Though investors should take note of the company’s leverage position ($644 million in long-term debt at the end of September 2013), shares continue to trade significantly below our fair value estimate ($60 per share). We find it odd that the company is trading at less than 12 times 2014 earnings. We think a 15 times multiple is much more appropriate for a company growing revenue and earnings at a low- to- mid-single-digit clip and generating gobs of free cash flow (about $224 million in 2013, or about 14% of revenue). Deluxe’s score is a 9 on our Valuentum Buying Index.

Image Source: Deluxe
The NASDAQ OMX Is Getting More Efficient; Trades at Less Than 12 Times Earnings
On Wednesday, NASDAQ OMX (NDAQ)—considered by us to be one of the ‘Top 25 Cheapest Stocks Over $10 on the Market Today’—reported decent third-quarter results. Third-quarter revenues advanced 23% from the prior-year period, but excluding currency fluctuations and excluding acquisitions, net revenues jumped 4% year-over-year. Non-GAAP diluted earnings per share came in at $0.66 versus $0.62 in the prior-year period. Though this was only a modest jump, NASDAQ OMX noted that it is narrowing its full-year expense guidance toward the low end of its previous projections, revealing that bottom-line expansion will be more robust in future periods. As with Deluxe, however, we think investors should be cognizant of the $2.72 billion debt load, even though management continues to de-lever (it paid down $98 million during the current quarter). Though NASDAQ OMX’s performance hasn’t been blockbuster, it, too, is trading at less than 12 times next year’s earnings. As with Deluxe, for a company growing its top and bottom lines and generating robust free cash flow (see image below), we think a mid-teens earnings multiple is more appropriate and peg the company’s fair value estimate at $49. NASDAQ OMX’s score is a 9 on our Valuentum Buying Index.

Image Source: NASDAQ OMX
USG’s Shares May Be Too Cheap; Operating Leverage May Surprise
On Thursday, USG Corp (USG) reported solid third-quarter earnings, with all three of its business segments generating an operating profit: North American Gypsum, Worldwide Ceilings, and Building Products Distribution. Sales increased 12% to $925 million, while operating profit jumped to $75 million from $29 million previously. The company’s ‘North American Gypsym’ segment posted the highest third-quarter operating profit since 2006. Adjusted net income swung to a profit of $24 million compared to an adjusted net loss of $27 million in the third quarter of 2012. Diluted earnings-per-share was $0.21 in the period.
If the quarterly profit wasn’t exciting enough, we liked management’s comments about continuing to lower its break-even point and improving margins. USG’s business model continues to reveal considerable operating leverage (small changes in revenue result in large changes in operating income), and we think substantial growth in earnings in 2014 is readily achievable. A 64% incremental operating margin on new revenue works wonders on any bottom line.

Image Source: USG
We think USG’s fair value estimate is $44 per share; shares score a 9 on our Valuentum Buying Index. However, as has been the case with Deluxe and NASDAQ OMX, USG is a leveraged entity, with $2.3 billion in total debt standing down $873 million in total liquidity at the end of the third quarter of 2013. However, unlike the other two firms, USG’s free cash flow trends aren’t nearly as robust. Free cash flow during the first nine months of the year was a use of $60 million (negative $60 million). For this reason, we think USG is the riskiest of the three firms highlighted in this piece.
Note: Our best ideas at any given time are included in the portfolio of our Best Ideas Newsletter, while our best dividend growth ideas at any given time are included in the portfolio of our Dividend Growth Newsletter.