
As Valuentum members are aware, we think the oil majors each have their own respective strengths and weaknesses. Exxon Mobil (XOM) has consistently earned the best economic returns (ROCE) among peers, but its stock price is rich, trading at the high end of our fair value estimate range (at the time of this writing). ConocoPhillips (COP) continues to raise its production forecasts and is the second-best value-creator (ROCE) in the group. However, Chevron (CVX) has the strongest balance sheet among peers (it has the only net cash position), and by extension, is better-positioned to raise its dividend during the troughs of future energy-price cycles.
Meanwhile, BP (BP) continues to deal with the aftermath of its well-publicized 2010 oil spill in the Gulf of Mexico, while Shell (RDS.A) recently wrote down some of its North American shale assets, arguably sounding an alarm on the shale oil revolution in the US, despite ongoing worries of the long-term implications US shale oil discoveries may have on the health of the OPEC cartel. Still, we note that increased non-OPEC production remains consistent with our long-term crude oil and natural gas forecasts; read: ‘Valuentum’s Comprehensive Outlook for Crude Oil and Natural Gas Prices’.
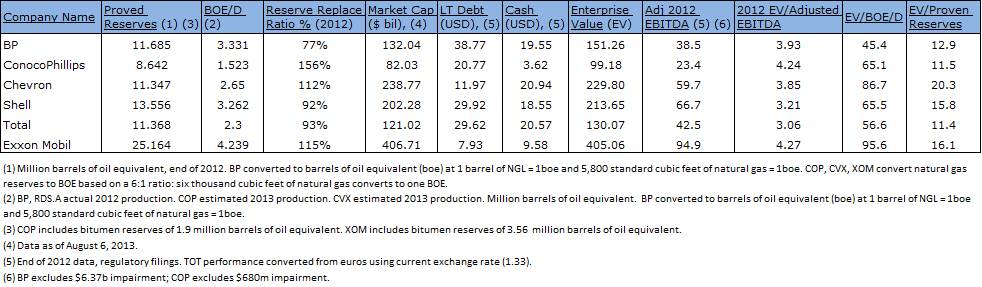
Source: Valuentum, Company Filings
Exxon Mobil
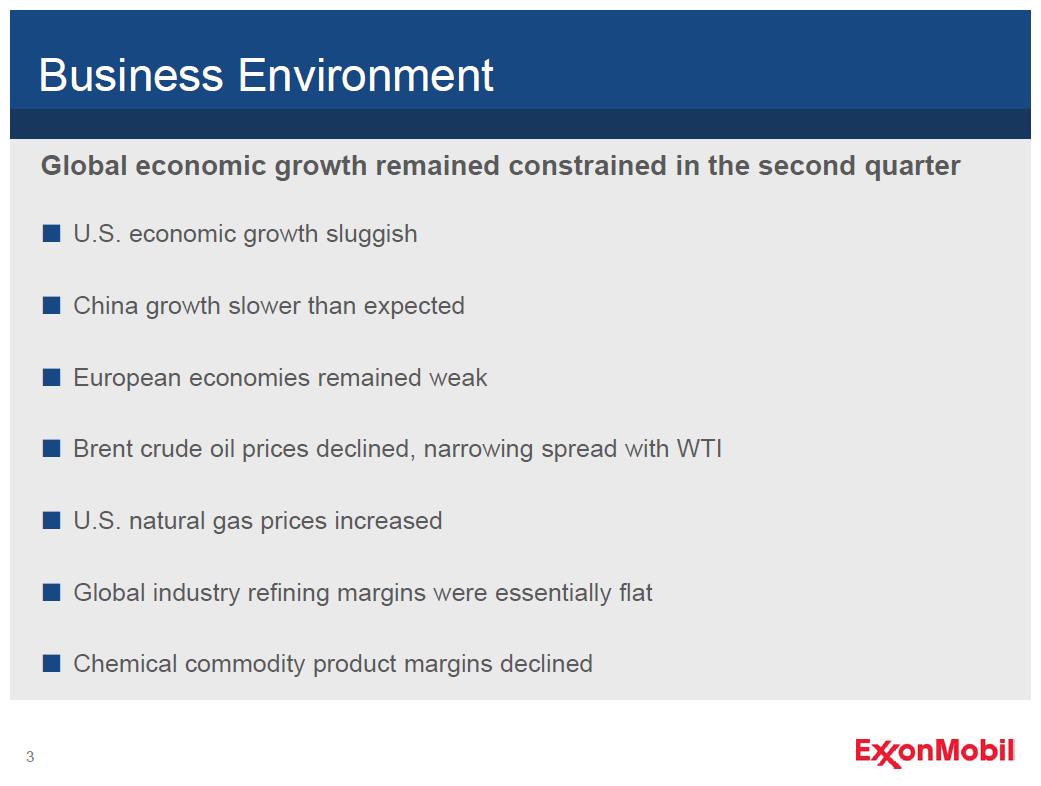
Image Source: Exxon Mobil
Exxon’s second quarter results, released August 1, missed expectations and showed a challenging period for the oil giant. Facing sluggish global growth, tightening spreads, and declining chemical commodity margins (see slide above), adjusted earnings fell nearly 19% from the same period a year ago. Upstream earnings of $6.3 billion in the period reflected a decline of 24.5%, though this was primarily impacted by the absence of a prior-year gain in Angola (oil-equivalent production dropped 1.9%). Downstream earnings also fell, but they, too, were impacted by the absence of a gain—this one associated with the Japan restructuring. Weaker refining margins hurt earnings by $510 million, while higher planned maintenance took a toll as well. Petroleum product sales and chemical earnings also dropped. The second quarter was a very messy one for the oil giant, and we would have liked to see better free cash flow performance in the period (-$2.2 billion). Still, we’re sticking with our fair value estimate of the company and are not reading too much into the poor near-term performance at this time.
Chevron
Chevron’s second-quarter performance, released Aug 2, also showed earnings declines as a result of softer conditions for crude oil and refined products and planned refinery repair and maintenance activities. Though upstream earnings fell roughly 12% in the period due to lower crude oil production, downstream earnings tumbled nearly 60% as a result of tighter refining margins on refined product sales. Still, Chevron retained its net cash position, something that is a large contributing factor to its very strong Valuentum Dividend Cushion score (a key consideration before we include a firm in our Dividend Growth portfolio). We think a strong balance sheet affords the oil major significant flexibility to return an increasing amount of cash to shareholders, even during difficult times.
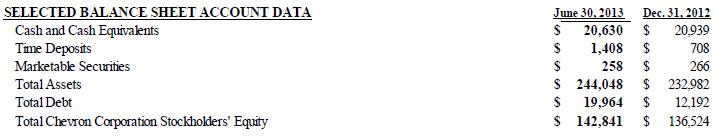
Image Source: Chevron
By comparison, ConocoPhillips $3.9 billion ending cash balance in its second quarter compares to a $21.2 billion long-term debt load. If Chevron levered up to the equivalent of ConocoPhillips on an absolute basis, such that both had a $17.3 billion net debt position, the firm could issue a one-time $17.9 billion dividend ($9.26 per share based on second-quarter diluted shares outstanding). We think Chevron’s financial flexibility will come in handy to the dividend growth investor during tough economic times. At the time of this writing, Chevron’s annual dividend yield is 3.2%, while ConocoPhillips annual dividend yield is 4.1%.
ConocoPhillips
But while we like the balance-sheet strength of Chevron, ConocoPhillips posted a very strong second quarter, released August 1. And unlike both Exxon and Chevron, adjusted earnings at ConocoPhillips advanced during the period ($1.8 billion versus $1.5 billion) thanks to margin enhancements from higher-value liquids. The company continues to deliver on its 3%-5% growth targets for both volumes and margins and even raised its production guidance. We’ve also been pleased with the firm’s cash margin improvement, which advanced to $27.10 ($/BOE) from $24.22 ($/BOE) in the same period a year ago.
Second-quarter production from the Eagle Ford, Bakken and Permian totaled 203 MBOED, up 47% year-over-year (suggesting Shell’s write-down may be more firm-specific). Impressively, Eagle Ford production leapt to 121 MBOED, nearly doubling the mark achieved in the second quarter of 2012.
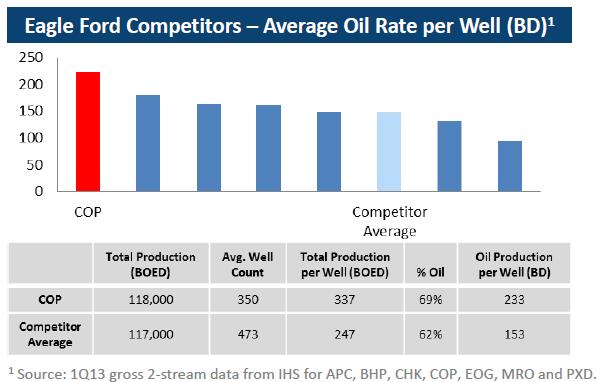
Competitors: Anadarko (APC), BHP Billiton (BHP), Chesapeake Energy (CHK), EOG Resources (EOG), Marathon Oil (MRO), Pioneer Natural (PXD)
Image Source: ConocoPhillips
We recently cashed-in on ConocoPhillips as a holding in the portfolio of our Dividend Growth Newsletter, but we still include Phillips 66 (PSX), its recent spin-off, in the portfolio. Phillips 66 has raised its dividend a number of times since the split, and Conoco recently increased its dividend 4.5%.
BP
BP’s second quarter performance, released July 1, revealed underlying replacement cost profit (1) of $2.71 billion compared with $3.55 billion in the second quarter of 2012. The firm recorded a net adverse impact on a pre-tax basis of $209 million for the second quarter relating to the Gulf of Mexico oil spill, but posted very solid net cash from operations improvement in the period ($5.4 billion, up from $4.4 billion). Still, free cash flow was negative in the quarter, as capital investments totaled $5.8 billion. The company announced a quarterly dividend of 9 cents per ordinary share ($0.54 per ADS), to be paid on September 20, 2013.
We’re not expecting much from BP in the coming months, with third-quarter production expected to be lower than the second quarter and refining margins to decline on a year-over-year basis for the remainder of the calendar year. Though we have little negative to say about BP’s dividend, given the firm’s $28.3 billion cash hoard sitting on the balance sheet, we prefer a net cash position (or a smaller net debt position) to get more comfortable with the firm’s ability to increase the payout during difficult times (its net debt position was $10 billion at the end of the second quarter).
(1) Underlying RC profit or loss is RC profit or loss after adjusting for non-operating items and fair value accounting effects.
Royal Dutch Shell
Shell’s second quarter results, released Aug 1, were clearly disappointing, punctuated by a $2.1 billion after tax impairment charge “predominantly related to liquids-rich shale properties in North America” and the impact of the deteriorating operating environment in Nigeria. Free cash flow performance, however, wasn’t terrible, as the firm squeezed out roughly $1.1 billion in the quarter (cash from operations of $12.4 billion less $11.3 billion in capital expenditures).
As CEO Peter Voser outlines in the video discussing second-quarter performance below, Shell remains on track to generate between $175-$200 billion in cash from operations from 2012-2015, 30%-50% higher than the prior four years. Net capital investment is expected to be $120-$130 billion during those same four years, so free cash flow should be robust for dividend increases and buybacks. The firm announced a second-quarter $0.45 per ordinary share dividend and a $0.90 per ADS dividend, a 5% increase with the second quarter of 2012.
Video Source: Shell
Total (TOT)
Total issued a second-quarter performance update July 26 that showed declines in sales and adjusted net profit, the latter down about 1% from the same period a year ago (in USD). Adjusted cash flow from operations jumped 7% in the quarter, but still trailed capital investment during the period, resulting in negative free cash flow. Its upstream and refining/chemical operations performed much better than peers, while its ‘Marketing & Services’ operations revealed significant year-over-year expansion.
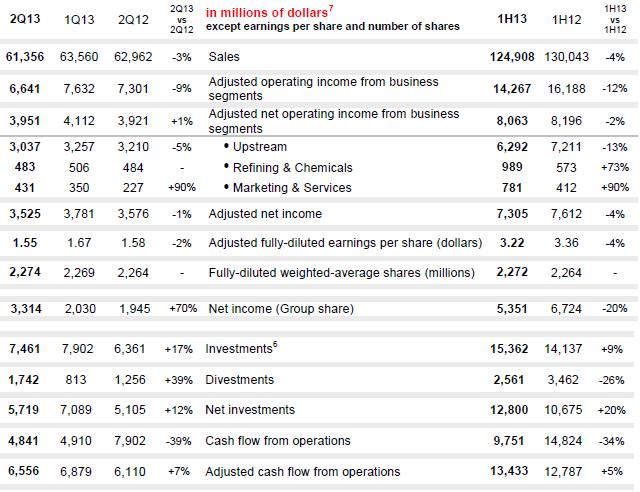
Image Source: Total
We’re looking forward to a decent second half of 2013 at Total. The firm should see its first oil from the giant Kashagan project in Kazakhstan and benefit from increased production in Nigeria. Total is also evaluating the launch of two additional major projects before year-end: Yamal LNG in Russia and the Fort Hills in Canada. Its partnership with Saudi Aramco should also give it a boost in efficiency at its refining and petrochemical operations.
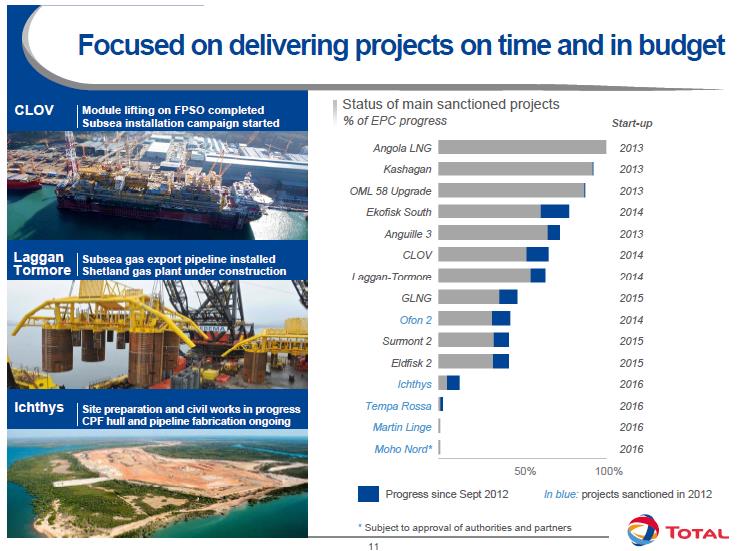
Image Source: Total
Valuentum’s Take
The performance of the oil majors during the second quarter was less-than-stellar, with perhaps the exception of ConocoPhillips, which put up decent year-over-year results. Though we continue to monitor the group closely, we continue to hold Chevron in the portfolio of our Dividend Growth Newsletter.