Update: Digging Into the Valuentum Dividend Cushion
Sign Up to Receive our Dividend Growth Newsletter!
Add the High Yield Dividend Newsletter to Your Membership!
History has revealed that the best performing stocks during the previous decades have been those that shelled out ever-increasing cash to shareholders in the form of dividends. In a recent study by Ned Davis Research, S&P 500 stocks that initiated dividends or grew them over time registered roughly a 9.6% annualized return since 1972 (through 2010), while stocks that did not pay out dividends or cut them performed poorly over the same time period.
Such analysis is difficult to ignore, and we believe investors may be well-rewarded in future periods by finding the best dividend-growth stocks out there. As such, we've developed a rigorous dividend investment methodology that uncovers firms that not only have the strongest dividends but also ones that are poised to grow them long into the future.
How did we do this? Well, first of all, we scoured our stock universe for firms that have cut their dividends in the past to uncover the major drivers behind the dividend cut. This is what we found out: The major reasons why firms cut their dividend had to do with preserving cash in the midst of a secular or cyclical downturn in demand for their products/services or when faced with excessive leverage (how much debt they held on their respective balance sheets) during tightening credit markets.
The Importance of Forward-Looking Dividend Analysis
Informed with this knowledge, we developed the forward-looking Valuentum Dividend Cushion™, which is a ratio that gauges the safety of a dividend over time.
Most dividend analysis that we’ve seen out there is primarily backward-looking – meaning it rests on what the firm has done in the past. Although analyzing historical trends is important, we think assessing what may happen in the future is even more important. The S&P 500 Dividend Aristocrat List, or a grouping of firms that have raised their dividends for the past 25 years, is a great example of why backward-looking analysis can be painful. One only has to look over the past few years to see the removal of well-known names from the Dividend Aristocrat List (including General Electric and Pfizer) to understand that backward-looking analysis is hardly worth your time. After all, you’re investing for the future, so the future is what you should care about more.

We want to find stocks that will increase their dividends for 25 years into the future, not use a rear-view mirror to build a portfolio of names that may already be past their prime dividend growth years. The Valuentum Dividend Cushion™ measures just how safe the dividend is in the future. It considers the firm’s net cash on its balance sheet (cash and cash equivalents less debt) and adds that to its forecasted future free cash flows (cash from operations less capital expenditures) and divides that sum by the firm’s future expected dividend payments. At its core, it tells investors whether the firm has enough cash to pay out its dividends in the future, while considering its debt load. If a firm has a Valuentum Dividend Cushion™ above 1, it can cover its dividend, but if it falls below 1, trouble may be on the horizon.
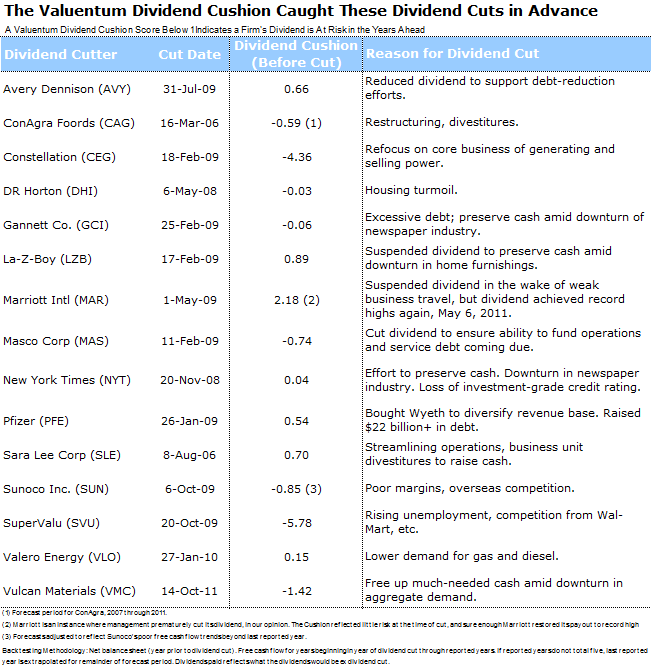
In our study, the Valuentum Dividend Cushion™ process caught every dividend cut made by a non-financial, operating firm that we have in our database, except for one (Marriott). But interestingly, the Valuentum Dividend Cushion™ indicated that Marriott should have never cut its dividend, and sure enough, two years after the firm did so, it raised it to levels that were higher than before the cut. Here are the results of the study (a Valuentum Dividend Cushion™ below 1 indicates the dividend may be in trouble). The Valuentum Dividend Cushion™ ratio shown in the table below is the measure in the year before the firm cut its dividend, so it represents a predictive indicator. The measure continues to do well by members in real-time as well (beyond the constraints of any academic study).
Please view this article to learn more: Our Dividend Methodology...

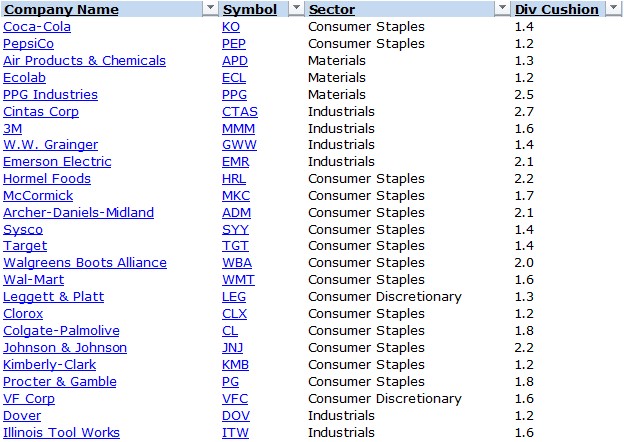
At the very least, using the Valuentum Dividend Cushion™ ratio can help you avoid firms that are at risk of cutting their dividends in the future, and we are the only firm out there that does this type of in-depth forward-looking cash-flow analysis for you. We provide the Valuentum Dividend Cushion™ ratio in the dividend reports and monthly Dividend Growth Newsletter, and we also scale the safety of a firm’s dividend based on this measure in simple terms: Excellent, Good, Poor, Very Poor. Here’s a glimpse of the Valuentum Dividend Cushion™ ratio (as of November 2017) for a sample set of firms in our coverage universe. Please note that the current score on these and hundreds more are available with a membership to our website.

Source: Valuentum
Understanding Dividend Growth
It takes time to accumulate wealth through dividends, so dividend growth investing requires a long-term perspective. We assess the long-term future growth potential of a firm’s dividend, and we don’t take management’s word for it. Instead, we dive into the financial statements and make our own forecasts of the future to see if what management is saying is actually achievable. We use the Valuentum Dividend Cushion™ as a way to judge the capacity for management to raise its dividend – how much cushion it has – and we couple that assessment with the firm’s dividend track record, or management’s willingness to raise the dividend.
In many cases, we may have a different view of a firm’s dividend growth potential than what may be widely held in the investment community. That’s fine by us, as our dividend-growth investment horizon is often longer than others'. We want to make sure that the firm has the capacity and willingness to increase the dividend years into the future and will not be weighed down by an excessive debt load or cyclical or secular problems in fundamental demand for their products/services. We scale our dividend-growth assessment in an easily-interpreted fashion: Excellent, Good, Poor, Very Poor.
What are the Dividend Ideas We Seek to Deliver in the Dividend Growth Newsletter?
First of all, we’re looking for stocks with dividend yields that are greater than the average of the S&P 500, or about 2% (but preferably north of 3%). This excludes many names, but we think such a cutoff eliminates stocks whose dividend streams aren’t yet large enough to generate sufficient income. Second, we’re looking for companies that register an 'EXCELLENT' or 'GOOD' rating on our scale for both safety and future potential growth. And third, we’re looking for stocks that have a relatively lower risk of capital loss, as measured by our estimate of the company’s fair value. We strongly prefer dividend growth gems that are underpriced.
Sign Up to Receive our Dividend Growth Newsletter!
Add the High Yield Dividend Newsletter to Your Membership!
A version of this article originally appeared on our website on November 26, 2011.